
Copyright © Panorama Group 1991 - 2026

KB "Panorama" has developed version 15.4.4 for the OS "Astra Linux Special Edition", "Alt Linux", "RED OS", Ubuntu, and AlterOS. The new version adds the ability to create custom toolbars combining modes of various tasks and buttons for launching Python scripts. Tools for configuring automatic object recognition on images have been improved, and the retrieval and display of terrain data via the OGC WCS protocol have been accelerated. Tasks for generating contours from elevation matrices, creating minimum flight altitude maps and conventional symbol maps have been implemented, and the functionality of spatial data export tasks to HTML, GML, and GeoJSON formats has been expanded. A customizable grid with object snapping to its nodes has been added, and tools for creating, editing, and searching map objects, spatial analysis, and report preparation have been supplemented.
The ability to create and has been added. Users can create their own toolbars by combining modes of standard tasks , , , modes of the main toolbar, or any implemented application task. Support is provided for placing buttons for launching Python scripts, which allows incorporating custom automation tools into the familiar program interface. The composition and order of tools can be changed, forming a convenient sequence of operations. Combining tools from various tasks on a single panel reduces the number of switches between them and provides quick access to functions necessary for daily work.
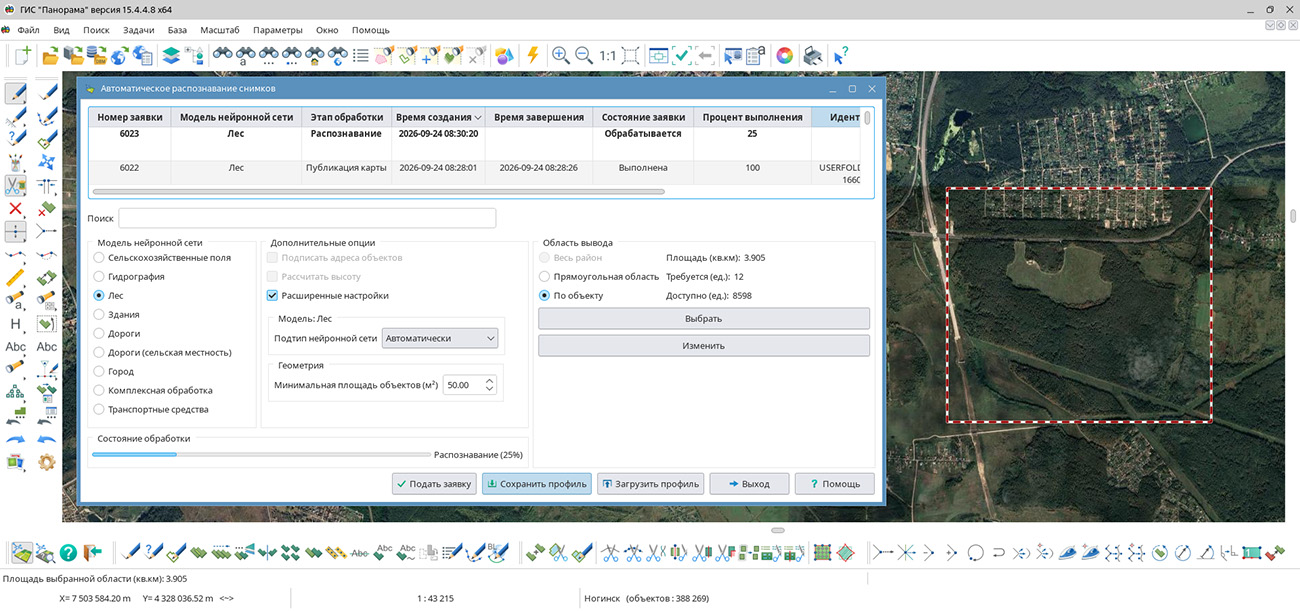
In the tasks and , functions for saving recognition parameters and working with request processing results have been added. The changes are aimed at reducing the number of manual operations and improving the convenience of working with the service when processing large territories. When selecting the output area "By Object", the contour of the selected object is transmitted to the server along with the request. At the final stage of processing, all recognized objects are automatically clipped to the boundary of the original contour. This allows interpreting data strictly within the boundaries of the selected object (rather than over a rectangular area), which is especially convenient when processing administrative districts and cadastral contours. A mechanism for saving recognition settings profiles in JSON format has been added. All parameters, including the neural network model, the class of recognized objects, and advanced vectorization parameters, are automatically saved when the dialog is closed and restored on the next launch of the task. In addition, "Save Profile" and "Load Profile" buttons have been added, allowing settings to be transferred between workstations or pre-prepared parameter sets to be used for various types of data.
In the task , it is now possible to select reference objects using a map filter. After configuring the filter, suitable objects are automatically highlighted on the map, which simplifies control of source data before launching processing. All selected objects are also saved in the recognition profile and restored on the next launch of the task. To improve convenience when working with the request list, the ability to delete completed requests via the context menu has been implemented. This allows maintaining the processing list in an up-to-date state and finding necessary results faster. A "Copy Layer to Map" command has also been added, allowing recognition results to be transferred directly to the current map. If the recognized layer was generated for the same map, objects are automatically re-encoded from the panvision.rsc classifier to the classifier of the current map.
The retrieval and display of terrain data requested via the OGC WCS protocol have been accelerated. Visualization is performed taking into account the current map scale: to speed up display, tiles corresponding to the current zoom level are requested from the server. At the same time, for analytical operations - building a terrain profile, querying information at a point, and other calculations - data of the highest resolution is always used. Connection to GIS WebService SE allows quickly obtaining elevation data for the entire globe. For example, the GEBCO layer with a resolution of 15 seconds contains data on ocean bathymetry, including depths, seabed topography, and names of underwater objects, as well as information on the elevation of land and ice surfaces.
In the dialog , the ability to save object attribute tables in HTML and DBF formats has been added. The HTML format provides convenient presentation of data in the form of tables for viewing in a web browser and preparing reporting materials. The DBF format provides the ability to further process exported data in various information systems, databases, and specialized software. XLSX support allows preparing attribute tables in popular spreadsheet editors (e.g., Microsoft Excel or LibreOffice) for performing calculations, analyzing object characteristics, building diagrams, and preparing summary reports. Expanding the list of supported formats simplifies data exchange between various software systems and improves the convenience of using cartographic work results.
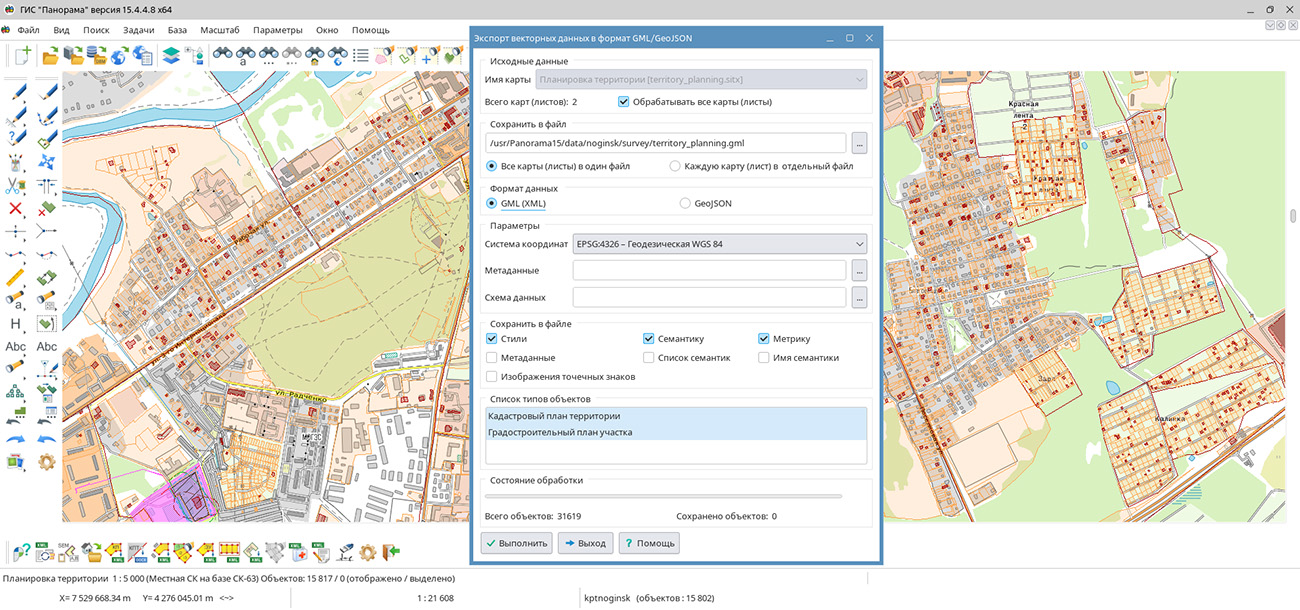
The task has been improved. A new mode for saving the appearance (styles) of objects has been added. In this mode, the image of point objects is saved as a picture in the output file. Data is saved to GML format in accordance with the OGC 02-070 version 1.0.0 - SLD (StyledLayerDescriptor) standard. Support for export to GeoJSON format has been implemented, providing transmission of geometry and attribute characteristics of objects for further use in web applications and other geographic information systems. Expanding export capabilities simplifies the exchange of spatial data and their integration into various software systems.
In the task, a mode for applying a geodetic coordinate grid to the inset frame of a map has been added. The coordinate grid is generated with a step specified in the task parameters dialog. A frame is formed around the map inset, on which latitude and longitude values of the generated grid lines are applied. When editing the inset contour or its content (changing scale, moving, and rotating the map), the grid is rebuilt automatically. For the "Edit Inset Content" mode, a new toolbar has been added that appears when the main mode is activated. The toolbar contains auxiliary modes available when editing inset content. Execution of these modes can also be activated by selecting the corresponding menu item that appears when right-clicking or pressing a hotkey.
A task has been developed, providing automatic creation of a vector representation of the terrain from one or more elevation matrices. Users can configure the composition of preliminary data processing: checking and correcting incorrect elevations, smoothing the surface, reconciling with elevation marks and hydrography objects. Smoothing parameters allow regulating the degree of change in the terrain surface. For reconciliation with hydrography, selection of layers and types of objects is provided, including watercourses and water bodies, as well as the use of objects with three-dimensional metrics. Matrix processing and contour generation can be performed independently, which allows taking into account the degree of preparedness of the source data. Results are saved on a separate user map or added to an existing one.
A task has been implemented, which automates the calculation and display of minimum permissible flight altitudes taking into account terrain and artificial obstacles. Joint processing of elevation matrices, elevation marks, and obstacle data allows taking into account the highest objects in each area and the required flight altitude above them. MORA and AMA calculation rules are supported, presentation of results in meters and feet, and formatting of labels in established conventional symbols. Saving information about elevation sources provides the ability to verify results, and hypsometric coloring helps visually assess differences between areas of the territory. Using a pre-prepared base map of maximum altitudes reduces the volume of repeated terrain processing when updating obstacle data.
A task for displaying a grid on a map has been developed, expanding the capabilities of precise object placement and visual control of cartographic data. Users can configure the grid step independently horizontally and vertically in meters on the ground or millimeters on the map, as well as shift its origin. Display is supported with lines, crosses, or dots with a choice of color and element sizes. Semi-transparent display and placement of the grid under objects allow maintaining map readability. Snapping to grid nodes helps organize the position of objects during creation, editing, and movement. The grid can also be used for visual assessment of the density of elevation marks and other objects when checking the design of topographic maps.
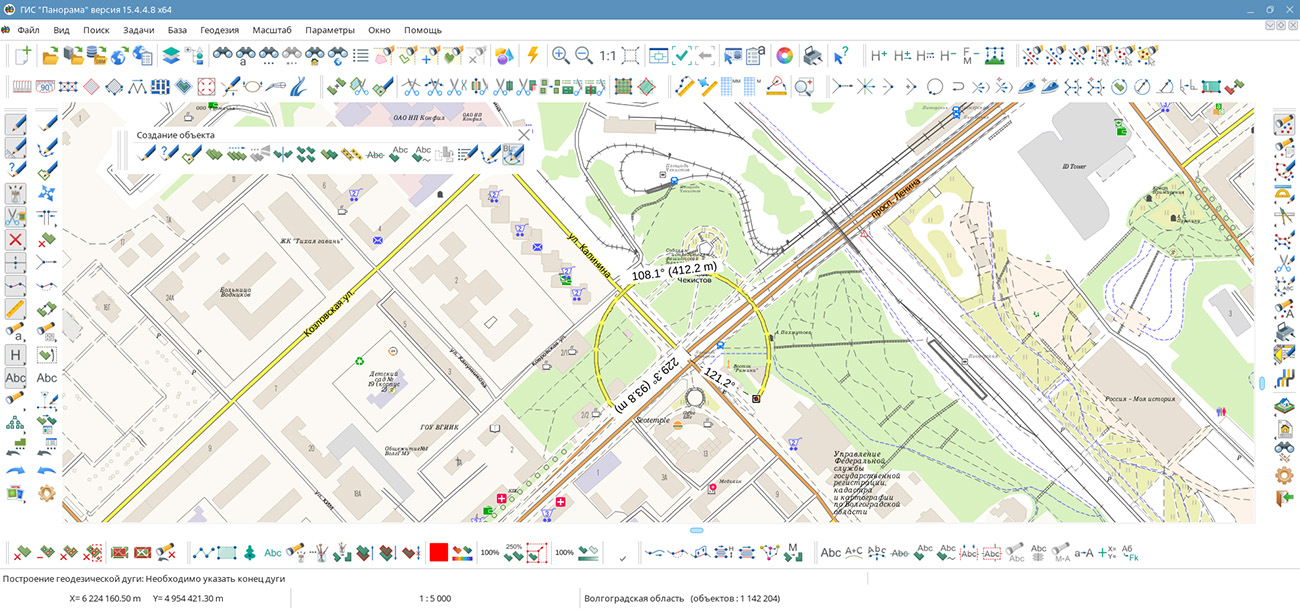
In the task, a new mode has been added. The mode is intended for placing an object on the map - an arc defined by three points: the center of the arc, its beginning, and its end. If the map supports geodetic coordinate calculation, constructions are performed on the ellipsoid. If the type of map on which the new object is being placed does not provide the ability to convert from rectangular coordinates to geodetic ones, constructions are performed in the flat rectangular coordinate system of the map. When creating a new object by entering coordinates from the keyboard, it is additionally possible to load coordinates of the object's geometry nodes from SHP, OGC GML, and GeoJSON exchange format files.
A mode has been added for creating area and linear objects from internal contours of one or more objects. When the mode is activated, it is necessary to select the type of objects to be created, then select an area object with subobjects. As a result, new objects will be created for each internal contour of the selected object. To create objects from subobjects of several objects, area objects must be selected before activating the mode. Selection of map objects is performed using the "Map Object Search" dialog or other object selection modes.
A mode has been added. The mode allows deleting subobjects of area objects and additional contours of linear objects within a user-selected area. When processing multipolygons, internal and external subobjects are deleted, except for the main contour. Processing order: when the mode is activated, it is necessary to select the object to be edited, then draw an arbitrary area contour. To finish drawing, double-click the left mouse button - subobjects in the selected object will be deleted. When drawing an additional area for the selected object, subobjects in the new area are deleted.
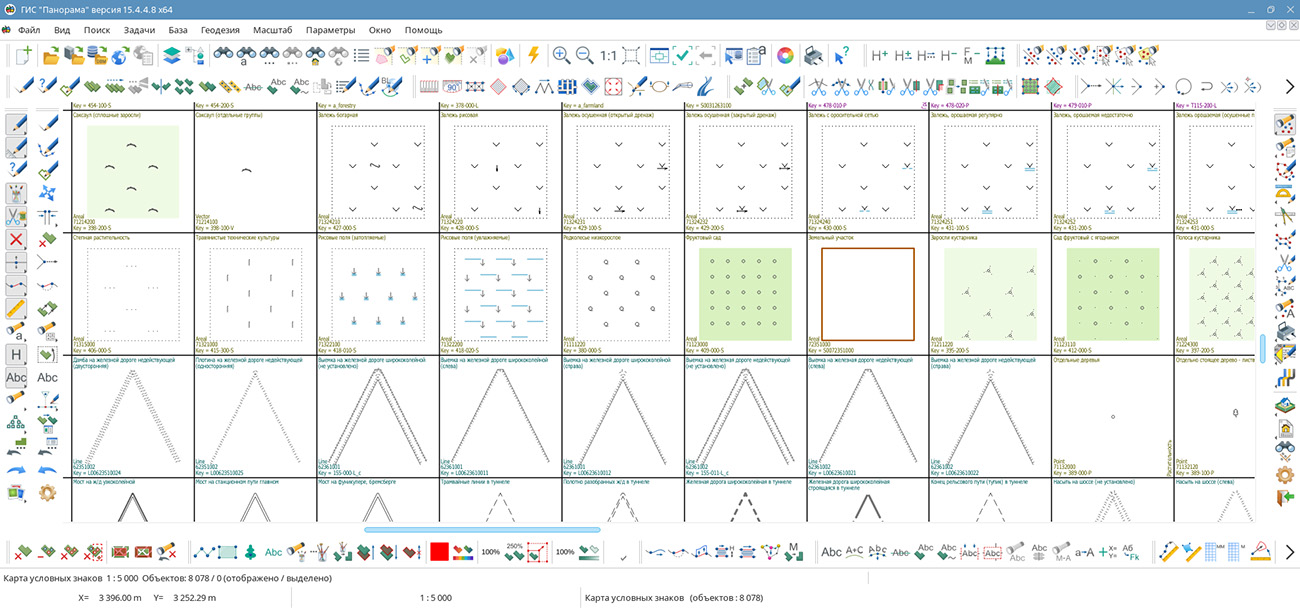
A task has been developed, allowing automatic creation of a visual catalog of all objects of the selected classifier. Images of conventional symbols are placed in separate frames and accompanied by names, codes, and keys of objects. Such a representation simplifies familiarization with the classifier composition, comparison of conventional symbols, and verification of their design. Users can configure frame sizes for convenient display of cartographic symbols. The generated map automatically opens in the program, providing the ability to view the entire set of conventional symbols without sequentially selecting objects in the classifier editor.
A task has been developed, allowing quick location of objects on the map by a pre-prepared list of names. Users can transfer lists from tables, documents, and other sources via the clipboard. The program compares names with the values of the semantic characteristic "Proper Name" and highlights the corresponding objects on the map. The new mode reduces the time for searching groups of objects and simplifies comparison of external lists with cartographic data. A task for calculating the value of a characteristic at a point has been developed, which allows determining the value of a selected numerical characteristic at a specified map point. This allows taking into account only the necessary data when studying a specific indicator. Obtaining calculated values directly at selected points simplifies the assessment of spatial change in characteristics and the analysis of territories based on data stored in object semantics.
GIS "Panorama" is a universal domestic geographic information system. The program is intended for accumulating, storing, automated processing, and displaying data, calculation results, and forecasts that have geospatial referencing. GIS "Panorama" contains tools for displaying and processing vector, raster, and matrix maps. The application provides users with tools for solving specialized tasks of modeling the movement of special objects against the background of a 3D model, forecasting the consequences of emergencies at hazardous facilities, monitoring aircraft movement, conducting geodetic and topographic work, processing data from GPS/GLONASS navigation devices, printing displayed spatial data to various output devices, and many others.
The new version of the program is available for download in the Download section.

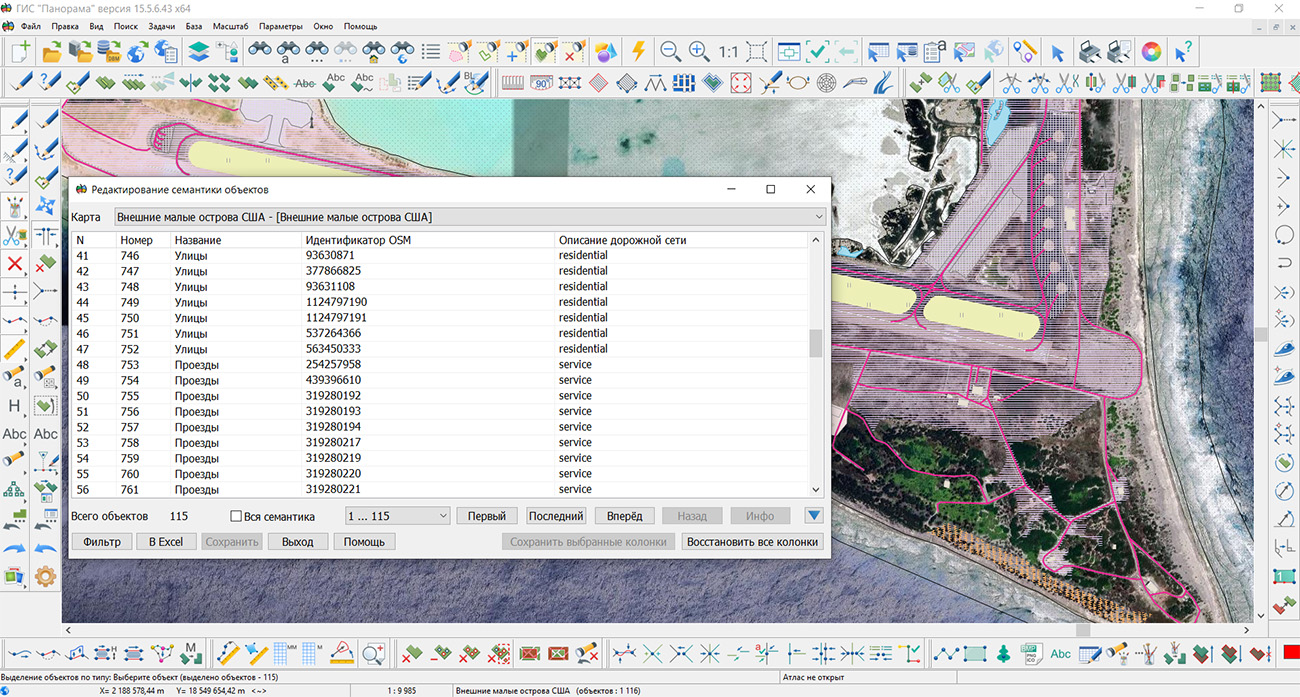
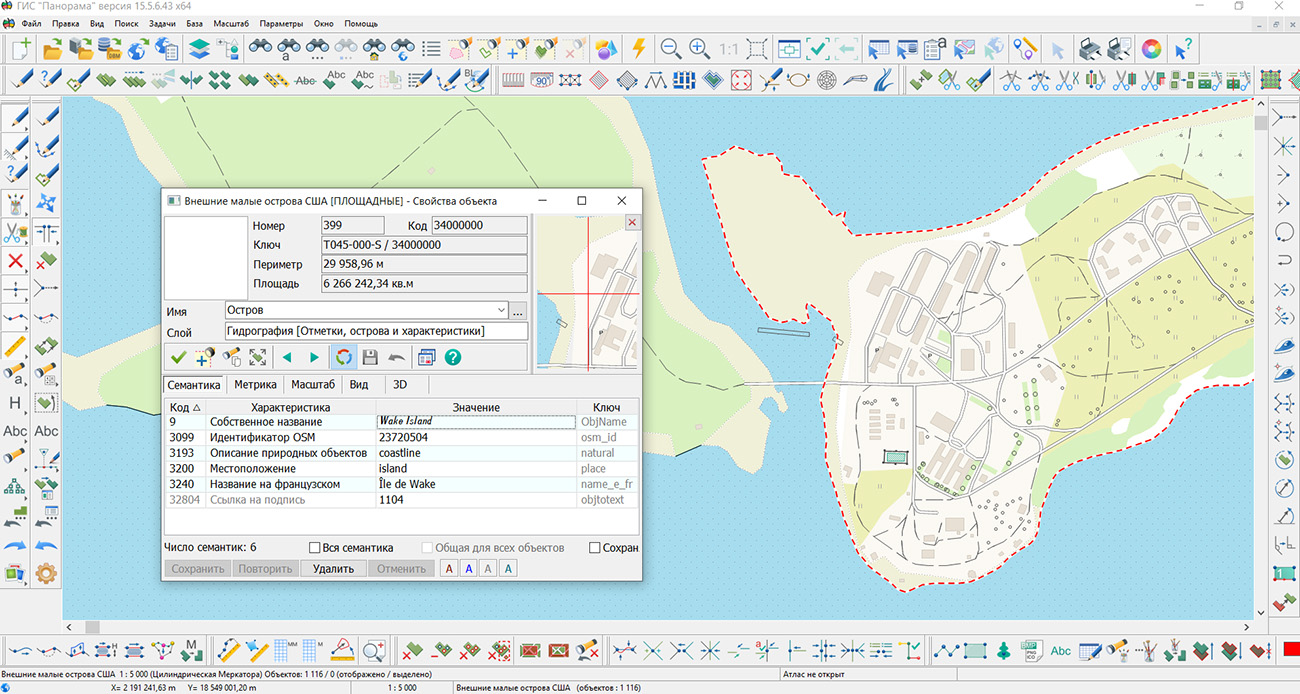
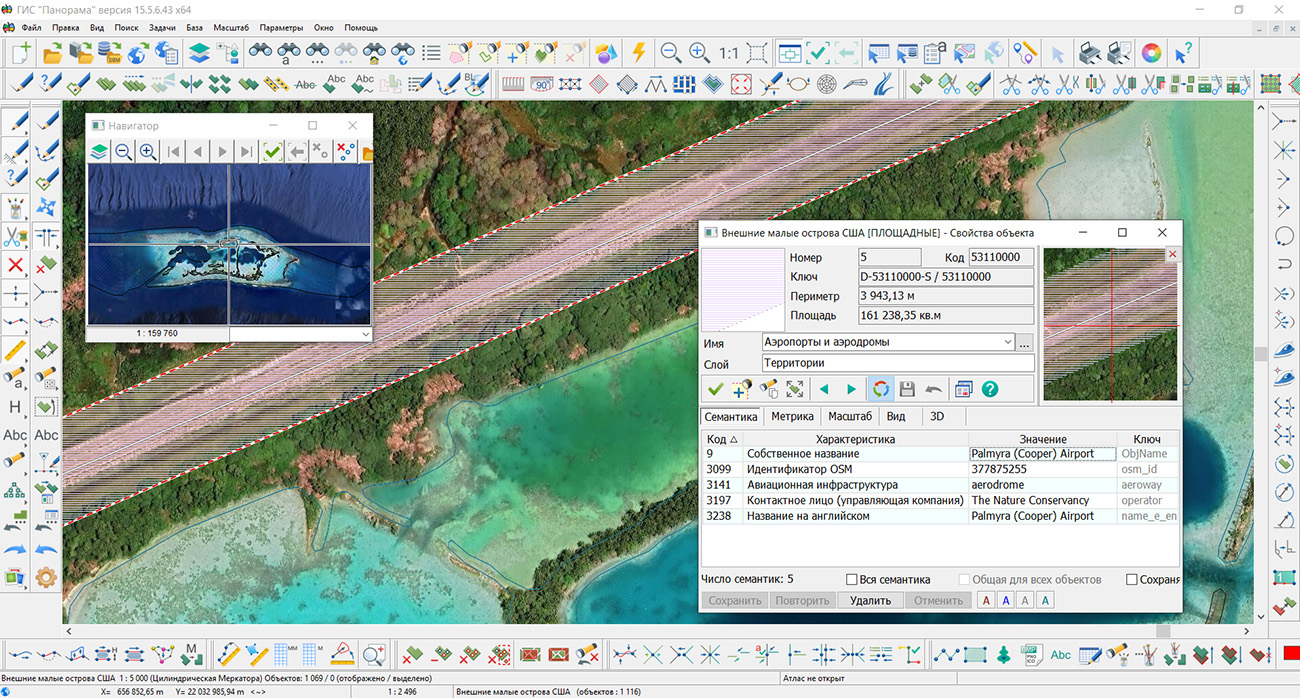
Specialists from KB "Panorama" have prepared and placed on the geoportal a map of the United States Minor Outlying Islands. The map was generated from OpenStreetMap data. To work with the map, you can use the program or other KB "Panorama" software products.
The map has been brought into compliance with the modernised classifier of large-scale plans at a scale of 1:5,000 (map5000m) and saved as a packed project (MPTZ). The MPTZ project includes a digital map covering the territory of the region (country, federal subject, administrative district) and a digital classifier. Updates were placed in the bank of spatial data using the program. Publication of the contents of the bank of spatial data on the geoportal and access to the data for downloading are implemented by means of .
Free maps based on OpenStreetMap data are available for download on the "Digital Maps" page.

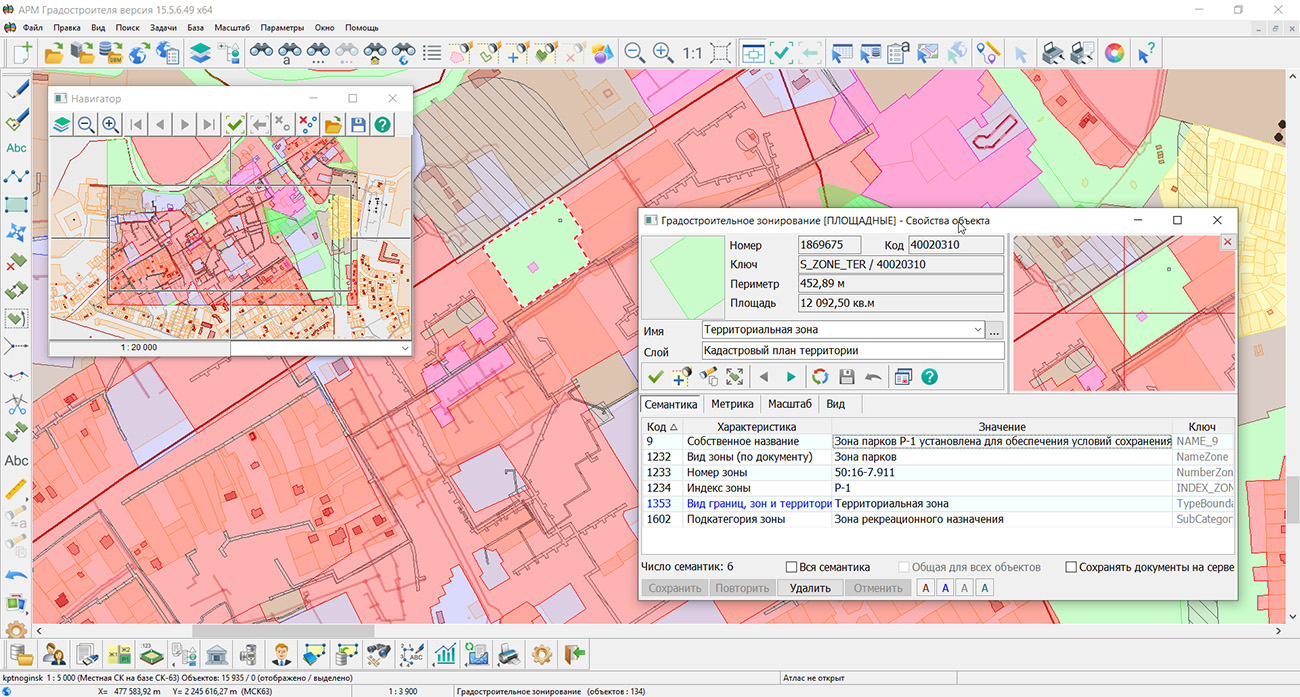
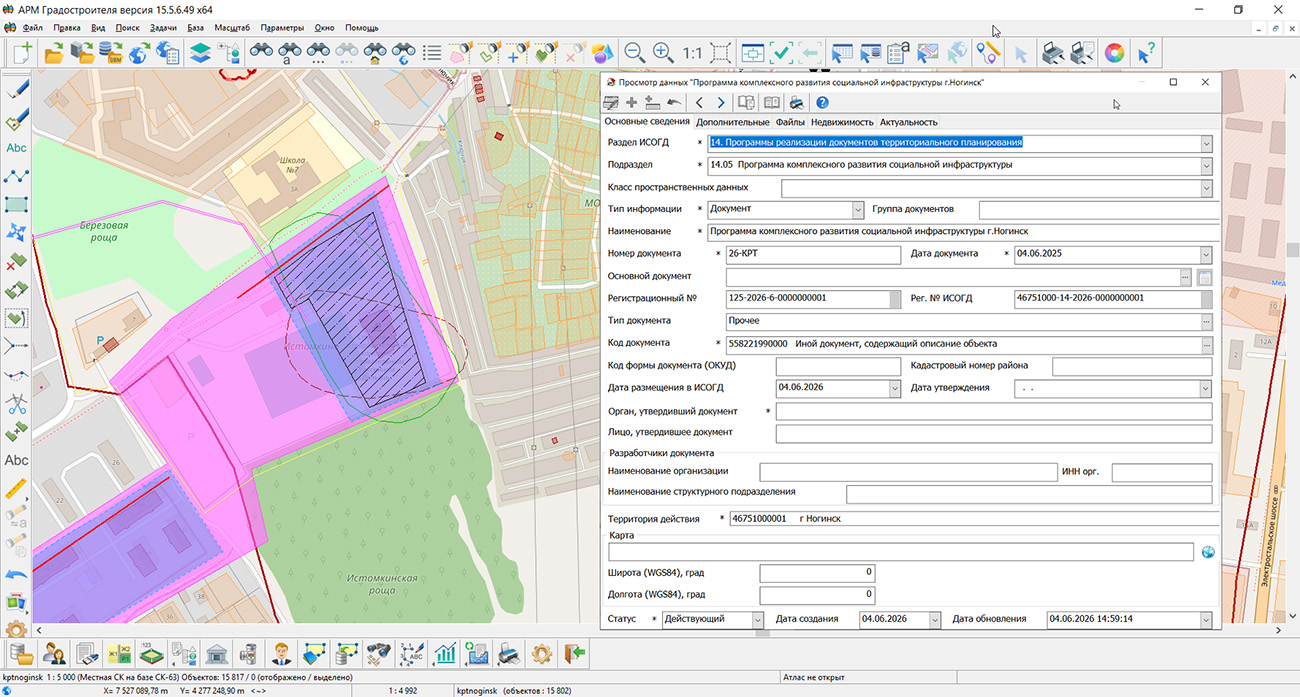
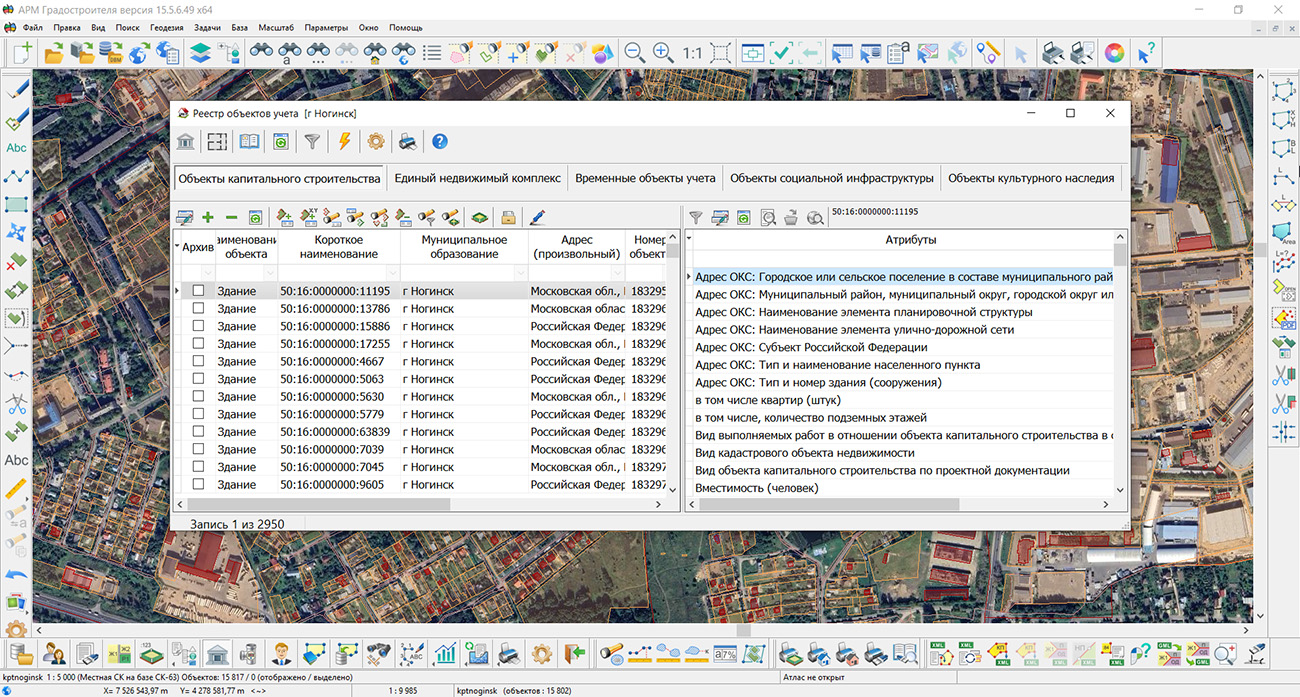
KB "Panorama" has updated version 15.5.6. The program has expanded tools for creating and editing spatial objects, analyzing remote sensing materials, working with terrain data, and preparing reporting materials. The new capabilities help specialists maintain urban planning maps more accurately, identify changes in the territory faster, and use spatial analysis results in territorial planning, urban planning zoning, territory planning, and management of the land and property complex.
In the , construction of a geodetic arc by three points has been added. If the map supports geodetic coordinate calculation, construction is performed on the ellipsoid; for other maps, the flat rectangular coordinate system is used. When entering coordinates from the keyboard, object geometry points can be loaded from SHP, OGC GML, and GeoJSON files. This reduces manual input and allows using survey results and data from related information systems when placing designed objects, engineering structures, and elements of the planning structure.
New modes for working with contours allow creating area and linear objects from subobjects of selected objects, as well as deleting internal and additional contours in a specified area. These tools simplify the formation of independent objects based on the complex geometry of territorial zones, land plots, and other elements of urban planning documentation. Specialists can correct boundaries faster and obtain topologically consistent data without re-drawing existing contours.
Joint use of "Urban Planner Workstation" with the automatic recognition and vectorization complex provides comparative analysis of urban planning maps and Earth remote sensing data. In the tasks and , data processing strictly within the boundaries of a selected object has been implemented. The contour transmitted to the server is used for automatic clipping of recognition results, which is especially convenient when surveying municipalities, cadastral quarters, and design areas. Neural network model parameters, object classes, and vectorization settings are saved in JSON profiles and can be applied at different workstations. The ability to select reference objects with a map filter helps pre-control source data, and transferring the recognized layer to the current map accelerates updating information about buildings, roads, water bodies, and other objects in the territory.
Retrieval and display of terrain information via the OGC WCS protocol have become faster due to requesting tiles in accordance with the current map scale. When building profiles and performing calculations, the program uses base resolution data, preserving the necessary accuracy of analytical operations. Connection to GIS WebService SE provides access to elevation and bathymetric data that can be used in assessing territory development conditions, preparing engineering infrastructure schemes, and substantiating design decisions.
In the , application of a geodetic coordinate grid to the map inset frame is provided. Latitude and longitude values are generated with a specified step and automatically updated when the scale, position, or rotation of the inset content changes. This improves the clarity and quality of cartographic materials included in urban planning documentation and analytical reports.
For presenting results at meetings and public discussions, the mode has been improved. It allows drawing graphic objects on the map in full-screen mode using a touch panel or mouse, rotating the image, and saving the prepared screen to a graphic file. Object attribute tables can now be exported to HTML for viewing and inclusion in reporting materials, as well as to DBF for further processing in databases and specialized information systems.
The updated "Urban Planner Workstation" combines cartographic editing, image analysis, work with terrain, and document preparation in a single environment. Automation of repetitive operations reduces the labor intensity of maintaining spatial data, helps specialists prepare substantiated decisions faster, and improves the quality of information support for urban planning activities.
The new version of the program is available on the website in the Download section.

Specialists of KB "Panorama" have prepared an educational video on automating the design of vector maps. The video tutorial demonstrates tools for generating labels based on semantic characteristics of objects and mass editing of already placed labels. Using a practical example, it demonstrates the formation of labels for selected map objects using the task , available to users. Values of semantic characteristics, coordinates, and elevations of objects can be used as text. The user selects the type of label to be created from the classifier, sets rules for its placement and other design parameters. Generation settings can be saved for subsequent use when processing similar data.
Depending on the nature of the objects, labels can be placed relative to the anchor point, along a linear object, or in the center of a polygon. For linear objects, text placement is provided at the beginning, middle, or end of the line, distribution of labels along its entire length, as well as text construction along the shape of the line. For area objects, the label can be placed in the center or oriented along the longest side.
A separate part of the video tutorial is devoted to working with already created labels. It demonstrates selection of labels on the map and their group editing. This approach allows changing the design for a set of objects at once and reduces the number of repetitive manual operations when preparing cartographic materials.
Tools for automatic generation and editing of labels are in demand in the preparation of topographic and thematic maps, cadastral and urban planning materials, engineering communication schemes, transport infrastructure, forest management, and other industry maps. With their help, it is possible to mass-apply names of objects, numbers of plots and buildings, characteristics of engineering structures, elevation and coordinate values, and other information contained in object attributes.
The reviewed capabilities will be useful to cartographers and geodesists, cadastral engineers, specialists in urban planning and land management, design and survey organizations, operating organizations, and enterprises maintaining their own spatial data. Automation is especially effective when working with large maps, where manual creation and correction of hundreds or thousands of labels requires significant time expenditure.
The video material can be viewed in the "Video Tutorials" section.


Specialists from KB "Panorama" have prepared and placed on the geoportal a map of the Falkland Islands. The map was generated from OpenStreetMap data. To work with the map, you can use the program or other KB "Panorama" software products.
The map has been brought into compliance with the modernised classifier of large-scale plans at a scale of 1:5,000 (map5000m) and saved as a packed project (MPTZ). The MPTZ project includes a digital map covering the territory of the region (country, federal subject, administrative district) and a digital classifier. Updates were placed in the bank of spatial data using the . Publication of the contents of the bank of spatial data on the geoportal and access to the data for downloading are implemented by means of GIS WebServer SE.
Free maps based on OpenStreetMap data are available for download on the page.


Ph.: +7 (499) 402-2445,
+7 (925) 221-1603
www.gisinfo.ru | panorama@gisinfo.ru
105005, Russia, Moscow, Baumanskaya Street,
house 7, building 1, office 229 (m. Baumanskaya)
Copyright © Panorama Group 1991 - 2026


 Mobile version
 Full version
