Copyright © Panorama Group 1991 - 2024

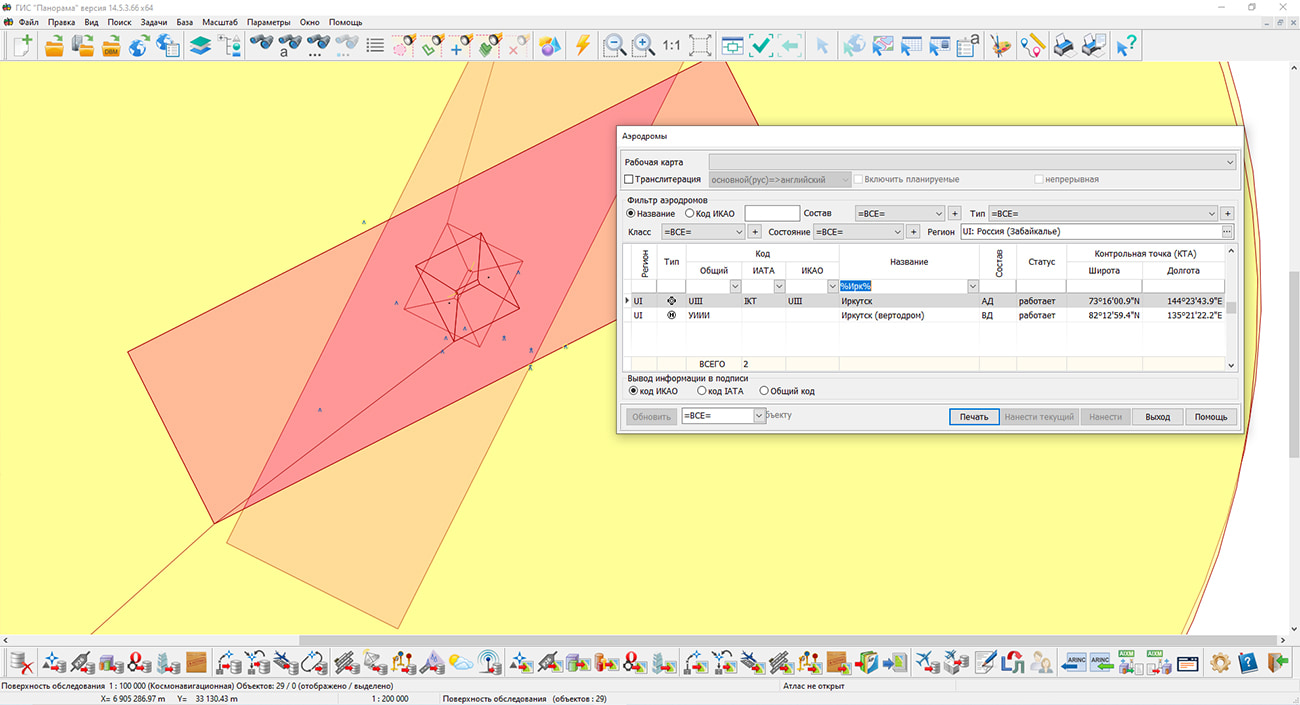
In KB "Panorama" the version 8.0.1 under the control of the has been developed. In the new version in dialog there is added a mode of formation of sheets of aeronautical passport of airdrome (heliport, landing site) of civil aviation in accordance with the order of the Ministry of transport of the Russian Federation dated November, 05th 2020.
In the dialog , the mode of generating the document "List of artificial obstacles" has been implemented in accordance with the general provisions for submitting data on artificial obstacles to the "CAI" Branch of the FSUE "State ATM Corporation". When filling in the templates, data from the database of the PostgreSQL version 9.4 and higher is used.
The information in the documents is presented in the established tabular form, automatic conversion of units of measure is carried out (for example, feet to meters and vice versa), when creating tables of obstacles by region, the value of the "Obstacle ID" field is analyzed.
The dialogs , have been improved. There are added new directories containing descriptions and abbreviations used to describe parameters (for example, ADR - Highways, ALM - Aluminum). The list of fields for entering parameters has been expanded: airfield type, (according to the type of runway surface), airfield type, estimated air temperature, geoid wave at the airfield elevation (m), characteristic (obstacle description) and others.
The complex for preparing documents of aeronautical information is a set of tools for maintaining an aeronautical data base, a modeling and analyzing the aeronautical situation, generating aeronautical maps and exchanging data with other information systems through export and import in the ARINC 424-19 exchange format and export in the AIXM 5.1 format. The task "Flight procedures design" is used to design the routes of departure, approach and landing and to analyze the safety of flights on them. The task "Assessment of compliance for aerodromes with the requirements FAR" is intended for the analysis of the aerodrome and the aerodrome environs for the suitability for operation and aircraft flights in accordance with the Federal Aviation Regulations.
The new version of the program, examples of aeronautical information documents, , video lessons and presentations are available for download on the page.


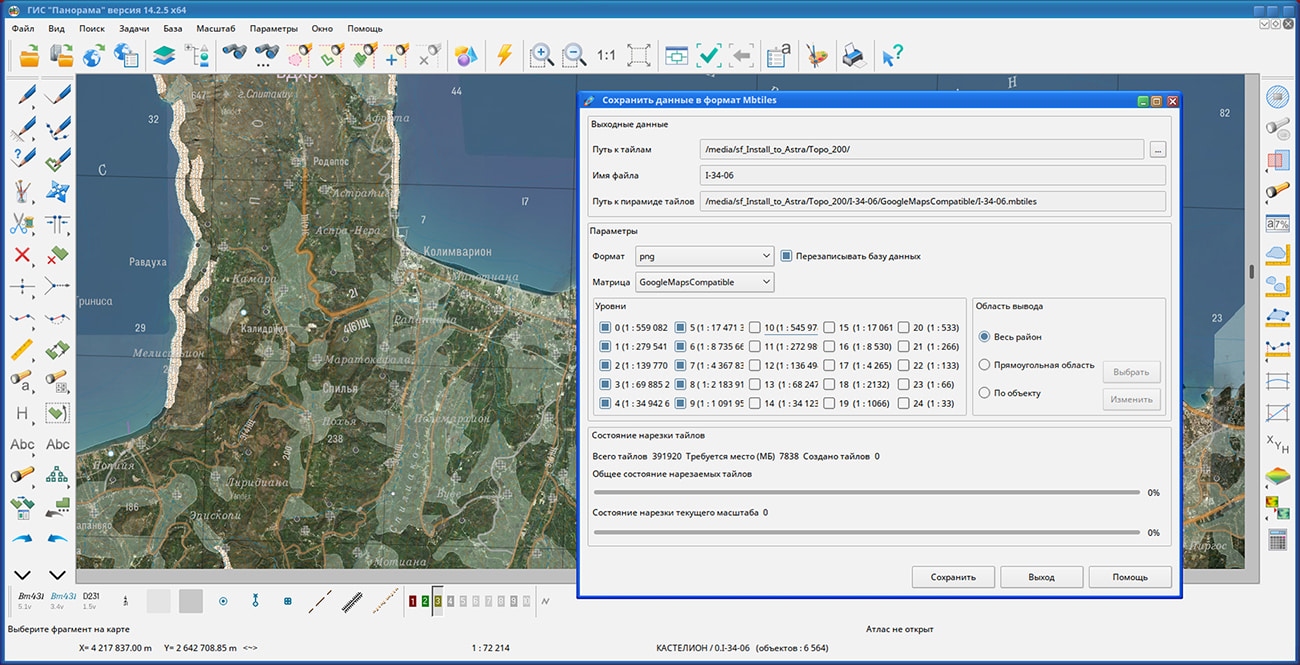
In KB "Panorama" the version 14.2.5 has been developed for OS "Astra Linux Special Edition" (release "Smolensk") and OS "Alt 8 SP" (architecture x86-64). In the new version the possibility of saving the spatial data into pyramids of tiles in Mbtiles format has been added, tasks of export and import of data of the DXF format have been improved. New modes of the "Map Editor" task have been developed, a type of programmable signs has been added to display bar charts, the list of scripts in the python language has been expanded, the efficiency of searching and displaying data has been increased by optimizing the allocation of RAM.
A new task of saving a pyramid of tiles into Mbtiles format has been developed, designed to create a complete set of spatial data image layers for the selected scale series. Mbtiles format is a SQLite database that stores images in png, jpg, png8 formats. The purpose of forming a set of rasters (tiles) is to speed up the display in mobile and web applications of spatial data containing a large number of objects or occupying large amounts of data. It allows in an offline mode to provide an access to pre-prepared spatial data. To create pyramids of tiles, a combination of digital vector maps, space and aerial photography, matrixes of heights, data from geoportals and other data can be used. Pyramids of tiles can be published via the OGC WMTS protocol by the service or displayed in the , GIS "Panorama" programs, in various mobile applications.
Export of the document of an electronic map into KMZ format has been added. The generated KMZ archive contains a KML project file and a set of pyramid tiles for the saved area. The KML file contains a description of the raster data parameters - the names and coordinates of the rasters binding, as well as their display priority. A fragment of an electronic map's document of any type and composition can be saved, including vector maps, images and matrixes, as well as geospatial data from external Internet resources (WMS and WFS services) and databases. The task implements the ability to save a map image by the selected area, by the page format and by the dimensions of the selected objects, for example, by the dimensions of frameworks of nomenclature sheets.
The task "Map Editor" has been improved. In the group of modes "Creating an object", the mode "Create clone" has been added. A clone is an object that has a link to the metric of the cloned object and its symbol.
Typically, such objects create objects of map design, for example, centerlines of roads. It allows to reduce volume of the stored data and to synchronise editing of the metrics of objects and their elements of registration. Allocation of objects of registration in separate objects-clones allows to execute them отрисовку after end отрисовки all made out objects and to raise quality of the image (for example to execute procleaning of crossroads of all roads). Problems of sorting, import and map export in formats SXF and TXF for support of objects-clones are finished. Modes a cutting of objects of a map inside and out of the chosen contour, giving possibility of group removal of marked: selected objects of an electronic map on the set contour are added. For the purpose of improvement of quality of a cutting of objects of a map accuracy of processing is increased. Upon termination of processing the rounding off of co-ordinates of the cut off contours is carried out. Thus metrics co-ordinates are led the accuracy specified in the passport of a map (centimetres, millimetres). In a mode "point Editing" the auxiliary mode "Trailer points in an alignment", intended for execution scraps or lengthenings of first or last piece of linear object is added. This allows you to reduce the amount of stored data and synchronize the editing of the metrics of objects and their design elements. Separating design objects into separate clone objects allows you to display them after the display of all designed objects is completed and improve the image quality (for example, clean the intersections of all roads). The tasks of sorting, importing and exporting maps in SXF and TXF formats have been improved to support clone objects. There are added the modes of cutting the map objects inside and outside the selected contour, providing the possibility of group deletion of selected electronic map's objects along a given contour. In order to improve the quality of cutting map objects, the accuracy of processing has been increased. At the end of processing, the coordinates of the cut contours are rounded. In this case, the coordinates of the metric are reduced to the accuracy indicated in the map passport (centimeters, millimeters). In the "Point editing" mode, the "End points in alignment" auxiliary mode has been added, designed to cut or extend the first or last segment of a linear object.
New type of programmable signs has been added for displaying bar charts according to the semantics of objects with display in a legend of semantics values (in addition to a sign displaying values in percentage). The description of diagrams includes a list of codes of semantics corresponding to sectors of the diagram. For each semantics the own parameters of displaying a sector are set. For all diagram the maximum width and the maximum height of the diagram are set. To the right of the diagram its legend is displayed. Texts of lines for signing of sectors are taken from semantics names, excepting repeating part of names. For example, if the semantics are called Number of inhabitants under 20 years old, Number of inhabitants from 20 to 40 years old, then the legend will contain the following lines: up to 20 years old, from 20 to 40 years old, and so on. The conventional symbol the "Bar chart" is shown in the data example on the map \Data\shape.
The tasks of exporting and importing data in DXF format have been improved. Saving and setting object color in RGB format has been implemented. The RGB color model covers a wider range of colors and provides the highest color rendition compared to the previously used indexed color of AutoCAD palette. Improved import from DXF format. Added recalculation of coordinates and sizes of characters from storage units specified in DXF: inches, feet, miles, millimeters, centimeters, meters, and so on. The formation of graphic primitives from the parameters of symbols specified in DXF has been improved, which allows you to reproduce the view of the original drawing without setting the symbols.
A script has been added into the list of basic python scripts that calculates the distance from the selected object up to several selected objects with recording into the semantics of the calculated value. RAM distribution has been improved when processing large data sets (tens of gigabytes and more than a hundred million objects). The speed of searching and displaying data has been raised.
GIS "Panorama" - universal domestic geoinformation system. The program is designed for accumulation, storage, the automated processing and display of data, calculation results and forecasts with geospatial reference. GIS "Panorama" contains tools of displaying and processing vector, raster and matrix maps. The application provides users with tools for solving specialized tasks of modeling the movement of special objects against the background of 3D model, forecasting of consequences of emergencies at hazardous objects, monitoring of aircraft movement, conducting of geodetic and topographic work, processing the data from GPS/GLONASS navigation devices, printing the displayed spatial data to various output devices and many others.
The new version of the program is available for download in the section.


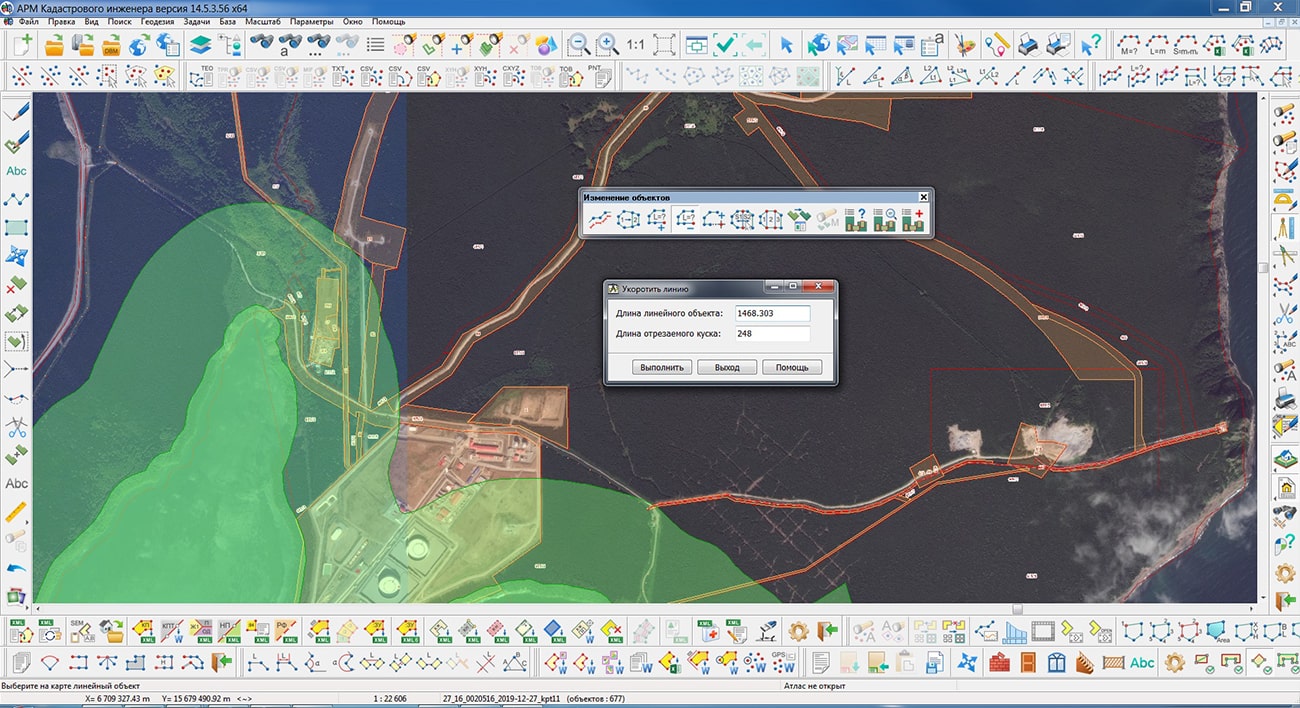
In KB "Panorama" the "Workstation of cadastral engineer" version 14.5.3 has been developed. In the new version the mode has been added. The form of the forest declaration, the procedure for filling out and submitting it, the requirements for the format of the forest declaration in electronic form were approved by the order of the Ministry of Natural Resources and Ecology of the Russian Federation dated April 29, 2021 N 303.
Formation of the forest declaration is carried out for selected objects of the map - forest areas. The map is created using the forestry.v2 digital classifier. Entering information for filling the form of the forest declaration is performed in the dialog by entering values or selecting elements from reference books of the unified regulatory and reference information of the federal forestry agency. Reference information is stored in SQLite database tables.
The new mode provides cutting from a linear object at the beginning or at the end of the metric of a section of a specified length.
The mode mode has been improved, which provides group filling of cadastral attributes. Using this mode, you can fill in the semantics "Cadastral numbers of buildings" for land plots. The program searches for real estate objects located inside the plots (for example, buildings), reads the initial semantics "Cadastral number" and fills in the output semantics. As a result of execution, each land plot will have the number of output semantics corresponding to the number of buildings located on it.
A new mode has been developed. The mode calculates the shortest distances in a straight line from the border of the selected objects to the specified (selected) map object. The result of calculations is mapped in the form of a linear object and a signing its length. When mapping, the standard options of the "Geodesy editor" from the "Editor" page are used. The calculated distance value is written into the semantics of a linear object.
The new version of the program is available on the website in the Download section.


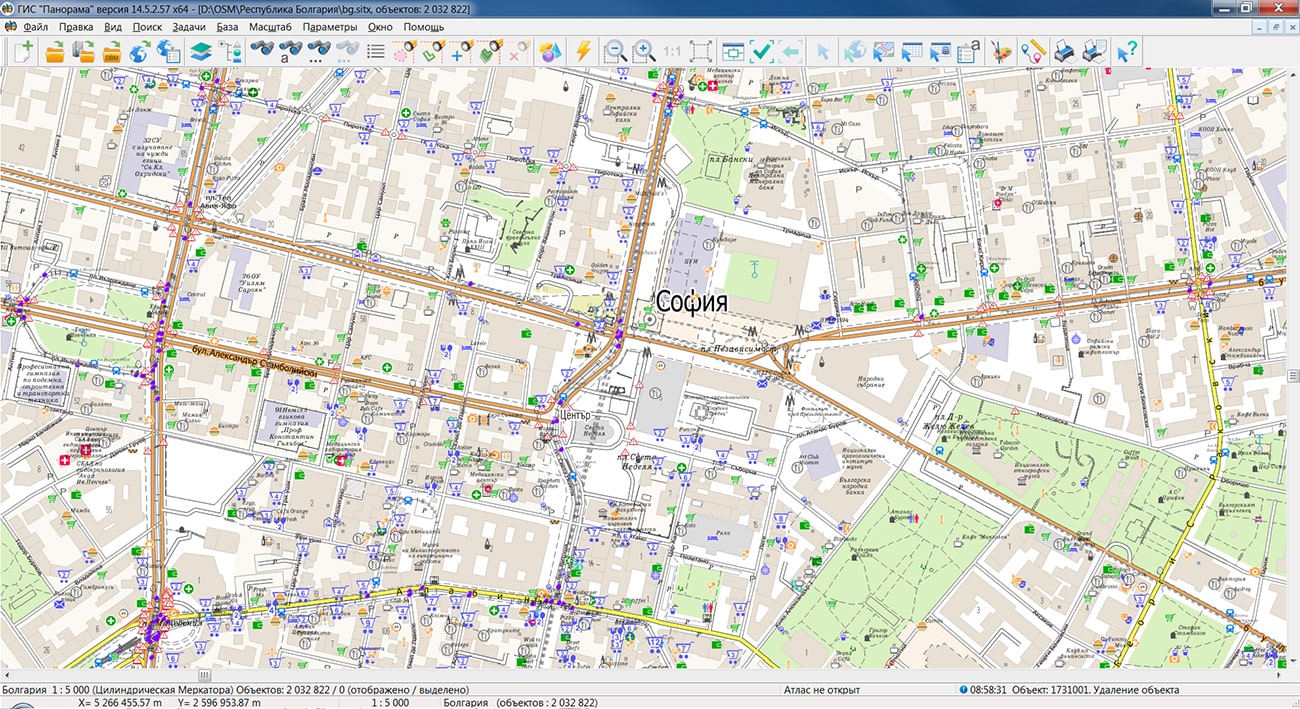
Specialists of KB "Panorama" prepared and posted on the geoportal maps of the Republics of Bulgaria and Serbia. Maps have been formed according to OpenStreetMap data. To work with maps, you can use the program or other software products of KB "Panorama".
The maps were led to the modernised classifier of large-scale plans of scale 1: 5 000 (map5000m). Publishing of updates in bank of spatial data is made by using the program of . Publishing contents of bank of spatial data on the geoportal and data access for downloading are implemented by means of .
Free maps on the basis of OpenStreetMap data are available for download on the page "Digital maps".


KB "Panorama" developed . In the new version, the task "Classifier editor" has been completely updated which controls the logical structure and classification system of vector map data. Tools for editing maps, preparing reports, processing elevation matrices have been improved, tools for preparing a forest declaration in electronic format (XML), preparing cadastral maps have been supplemented, and the complex for automated preparation of maps for publication has been updated.
The new version of the task has been developed. Information about the composition of the classifier is supplemented by the number of connected libraries with user signs, libraries of 3D signs and objects that have a three-dimensional appearance in the tab "General data". "Translation" tool has been added to translate the names of layers, objects and semantics of the classified into other languages. Operating the color palettes of the classifier is placed on a separate tab "Palettes". There is a convenient opportunity to simultaneously view and work with the colors of RGB and CMYK palettes. Adjusting the arrangement of colors in the palette table permits to arrange them with the greatest convenience for editing. For each color, there is shown the number of objects types for the classifier that use this color. This makes it possible to quickly see unused colors in the palette. The new tool "Transfer color to unused space" permits to reduce the size of the palette, if it is necessary. When a color is selected in the palette, a table of object types using this color is displayed at the bottom of the tab. From the table of types for objects on any tab, by double-clicking the left mouse button on the object, it is possible to go to the tab "Objects" to edit it. The new tool "Replace color in objects" permits to replace the selected color with another one in all classifier objects that use it. There are added tools for converting color from RGB to CMYK and vice versa. The field "Number of colors" for the palette displays the number of colors actually used in objects of the palette.
There is added the ability to create a palette of named colors. It has a tree structure and it can be used together with the main RGB palettes of the classifier. One example of its application is the stratigraphic (geochronological) scale, the geological time scale of the Earth's history. In the tab" Layers", there has been added a mode to view all layers together with their classes in the form of a tree. The tool "Classes" permits to add and edit classes for the selected layer. In the tab "Objects" there have been added tools for searching objects by name, code, symbolic code, key and other properties via "Object filter". In the subtab "Scale" there is added the ability to enter the arbitrary denominator of the scale for the lower and upper boundaries for the visibility of the object. In the subtab "Miscellaneous", there are added the properties of the object "Design object" and "Polygon with a dot". In the subtab "3D", there has been added the selection of the three-dimensional model of an object by types: near, medium, far. In the modes of creating or copying an object, all characteristics are filled in automatically. The operator is then prompted to change these fields if it is necessary. The tool "Creating and editing the series of objects" has been updated. Object properties: layer, class, visibility, additional object properties ("Miscellaneous" tab) - can be changed for all objects in the series at once or for one selected object. The tab "Clusters" has been added to describe the signs of clusters that display densely spaced point signs. The tab selects the types of objects related to each type of cluster, the cell sizes vertically and horizontally, the semantics code for specifying the current number of objects in the cluster, the type of cluster symbol, the limiting percentage for increasing the size of the cluster sign and the limiting number of objects corresponding to the maximum size of the sign cluster.
In the tab "Libraries", in the tree of custom functions for displaying objects, next to the name of the function, there has been added the number of types for objects in which it is used. When a function is selected in the object table, all types of objects that use this function are displayed in the right part of the tab. The tab "3D" has been supplemented with understandable tools for creating and connecting p3d-libraries of the three-dimensional view of objects. The enlarged view (zoomed-in view) of the selected texture has been added to make it easier to view textures when editing their composition. When the texture is selected at the bottom of the tab, there is displayed a list of objects in the 3D view of which it is used.
There has been improved the mode of the map editor which is included in the group "Cutting and stitching". The new algorithm cuts out not only areal, but also linear objects (according to the list of reference objects). By default, response points are saved in the reference objects created at the intersection of the contours for the reference and edited (cropped) objects. This method of processing lets to save the topology of the metrics for cropped objects with reference ones. If there is no need to save the topology (at intersections), then to speed up processing it is recommended to enable the option "Do not match points of edited objects with points of reference objects".
The task has been improved. There has been added the ability to automatically add the created legend to the report map as an inset map or insert an image, depending on the selected format of the saved legend in the mode "Formation of the legend".
The task for has been improved. There is added the support for the analysis of matrices in different coordinate systems. The task has been improved. The entry record has been added to the output file of the parameters of the vertical coordinate system, created in accordance with the height system of the source matrix. The file GeoTIFF stores the name of the vertical coordinate system, the height units contained in the file, and other parameters. For example: "Baltic 1977 height (EPSG:5705)", "MSL height (EPSG : 5714)", "WGS 84 (geographic 3D) (EPSG : 4327)".
The task has been improved. There is added the ability to import DEMs or images from files TIFF(GeoTIFF), IMG, KMZ contained in the selected folder. When enabling on the form of the element "Import heights from TIFF, IMG files", the control of the program is transferred to the dialog .
The new mode "Formation of the forest declaration in electronic format (XML) with attachments (appendices)" has been added to the task . The form of the forest declaration, the procedure for filling out and submitting it, the requirements for the format of the forest declaration in electronic form were approved by order of Ministry of Natural Resources and Ecology of the Russian Federation dated April 29, 2021 N 303. The forest declaration reflects information about the person who filed the forest declaration; on a lease agreement for a forest plot or other document in accordance with which the use of forests is carried out; about the location of the forest area; on the volume of forest use; on the types of forests use, which are provided for by the forest lease agreement, or other document in accordance with which the use of forests is carried out, the forest development project for the declared period. Formation of the forest declaration is carried out for selected objects of the map - forest areas. The map is created using the digital classifier forestry.v2.rsc. Entering information to fill in the forest declaration form is performed by selecting values from the reference book and from the semantic characteristics of the selected objects. The reference information is stored in the database tables SQLite.
The module has been improved. A new mode "Shortening the line (input distance)" has been developed. The mode provides cutting off from a linear object at the beginning (or at the end) of a segment of the specified length. The mode is included in the panel "Objects changing". The mode "Transfer of semantics to selected objects" has been improved. To perform the operation, it is necessary to select land plots on the map, for which it is necessary to fill in the repeatable semantics "Cadastral numbers of buildings" (code 1061). Next, in the mode dialog, specify the type of objects located inside the plots (for example, buildings), the initial semantics (Cadastral number, 1001) and the output semantics. As a result of execution, each land plot will have the number of output semantics corresponding to the number of buildings located on it. A new mode "Writing the shortest distance to selected objects" has been developed. The mode calculates the shortest distances in a straight line from the border of the selected objects to the specified (selected) map object. The result of calculations is plotted on the map in the form of a linear object and writing of its length. When plotting, the standard settings of "geodesic editor" are used, the page "Editor". The additionally computed distance value is written to the line semantics.
There are improved tools for automated map preparation for publication. There are added script procedures "Classification of captions by location" and "Removal of coinciding contours". In accordance with the design rules on topographic maps of scales 1: 25,000, 1: 50,000, 1: 100,000, conventional signs such as "Forest strip", "Power lines", "Communication lines", "Glades" ("Clearings") and road network objects are written by one type of caption "Explanatory captions and characteristics (T-132) 1.3 mm". From the point of minimizing view for the size of the digital classifier, this approach is optimal. From the point of view for automated processing when generalizing a map or preparing for publication, such approach is harmful: it is impossible to unambiguously determine whether a caption belongs to the written object. When performing these works, some fragments of linear objects can be removed, displaced, or change the shape of the contour (in the process of filtering, generalizing and smoothing the metrics). When deleting a contour, the corresponding caption with the characteristics of this contour should be deleted. When changing the contour, the position of the caption should be specified (alignment of the caption metrics with the road contour, or offset from the road by the specified distance). The procedure "Classification of caption by location" permits to automatically assign certain types of signs "Characteristics of the forest strip", "Characteristics of power lines", "Characteristics of communication lines", "Characteristics of clearing", "Characteristics of the road", "Road number". The classification of captions permits the separate processing of each type of captions. Captions of the type "Road number" are obsolete and can be removed: currently the vector sign "Road number" is written with text from the semantics "Road number", the width of the sign frame is calculated automatically according to the length of the caption. Captions "Characteristics of the forest strip" located on top of the signs "Forest strip" near the road can be automatically shifted by the required distance. Automatic displacement of captions is performed using the script procedure "Refining the position of vector characters".
The procedure "Removal of coincident contours" permits to automatically remove fragments of highways and trunk roads, the metrics of which partially coincide with vector bridges and captions of the type "Road characteristics". Before executing this procedure, the road intersections are processed. White and orange road decoration lines are created over the roads, masking the black outlines at intersections. Then the procedure "Removal of coincident contours" is performed, as a result of which fragments for the external black contours of roads are removed at the intersections with bridges and captions. The middle orange lines of the road design are saved.
The procedure for the scenario has been improved. This procedure performs the displacement of objects relative to the linear objects of the road network (taking into account the width of the roads). There is added processing of captions and point characters. The processing of captions is performed when specifying the position of the caption "Characteristics of the forest strip". Point signs are processed when specifying the position of individual trees. Procedures are launched in the dialog "Map Processing by Script", which is called via the main menu: Tasks - Preparing for Publication - Map Processing by Script.
There is improved RAM distribution when processing large data sets (tens of gigabytes and more than a hundred million objects). The speed of searching and displaying data has been improved. The new version of the program is available for download on the page .


Ph.: +7 (495) 739-0245, +7 (925) 221-1603
www.gisinfo.ru | panorama@gisinfo.ru
105005, Russia, Moscow, Baumanskaya Street 7, building 1, office 229 (m. Baumanskaya)
Copyright © Panorama Group 1991 - 2024


 Mobile version
 Full version