Copyright © Panorama Group 1991 - 2024

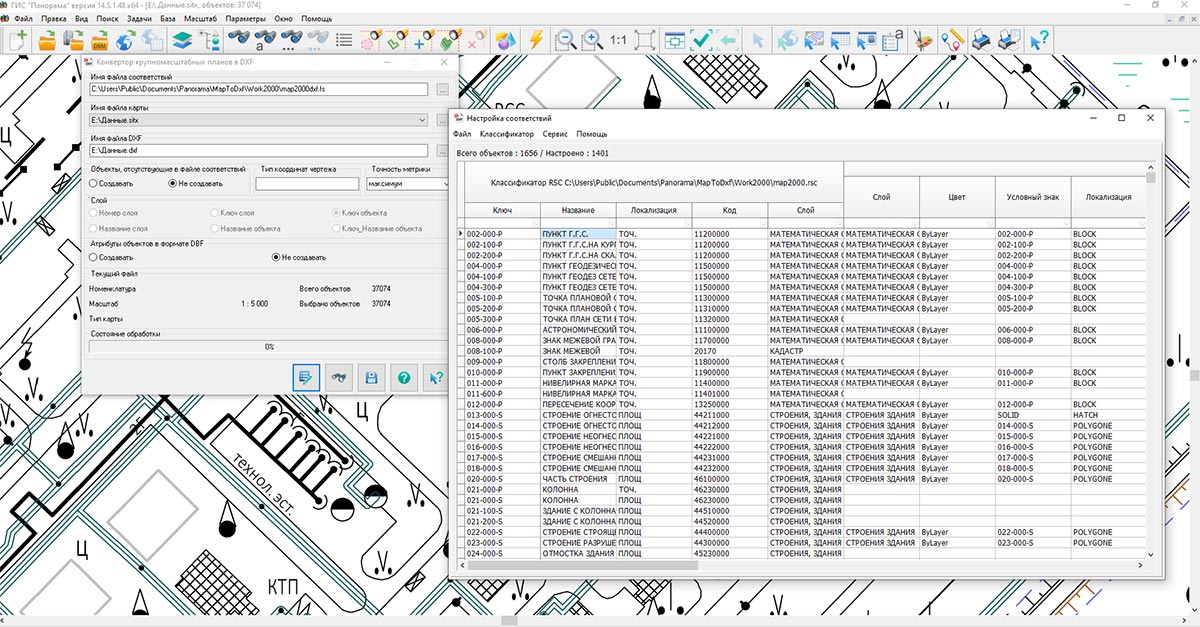
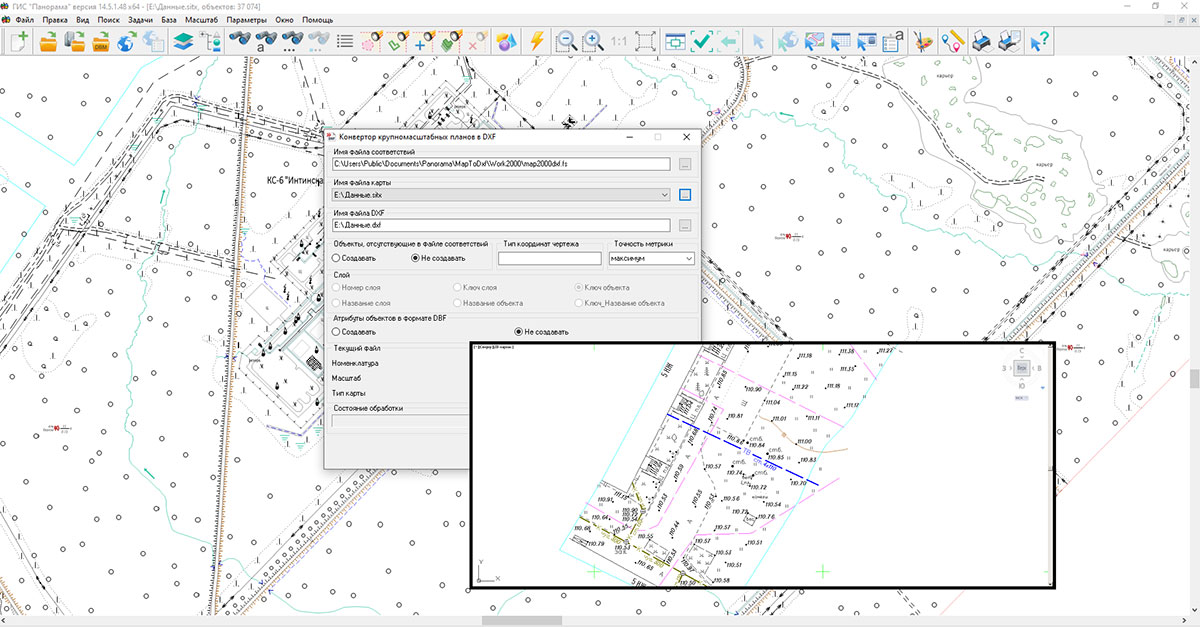
KB "Panorama" has developed the Converter of large-scale plans to format DXF version 8.6.0. The program lets to generate a large-scale topographic map or plan in format DXF in standard symbols adopted for cartographic work in the Russian Federation. In the new version of the program, the functionality has been expanded in terms of obtaining a drawing in the required units of measurement. When converting data, the coordinates of the source map objects are automatically converted to the established units of measurement. This lets to set up symbol templates for conversion in various programs that work in different coordinate systems. The program supports coordinate systems with the following units: inches, feet, miles, millimeters, centimeters, meters, kilometers, micro-inches, and so on up to light years and parsecs.
As part of import substitution, most domestic companies - manufacturers of cartographic data that previously used AutoDesk products (for example, AutoCAD) in their work, are forced to switch to alternative software that supports the format DXF. To ensure a more accurate transfer of the color palette for objects in the output map (DXF drawing), the functionality of setting the color code by index and RGB code has been corrected in the new version of the converter. This will display map data in the specified color palette when opened with alternative software.The new version of the converter now displays more detailed information about the license. In addition to the license key number, the user has access to information about the license validity period and the end date of the program technical support. The package includes classifiers and libraries of symbols in format DXF for large-scale maps and plans of scales 1: 500, 1: 1,000, 1: 2,000, 1: 5,000.
The new version of the program is available for download on the page Download.

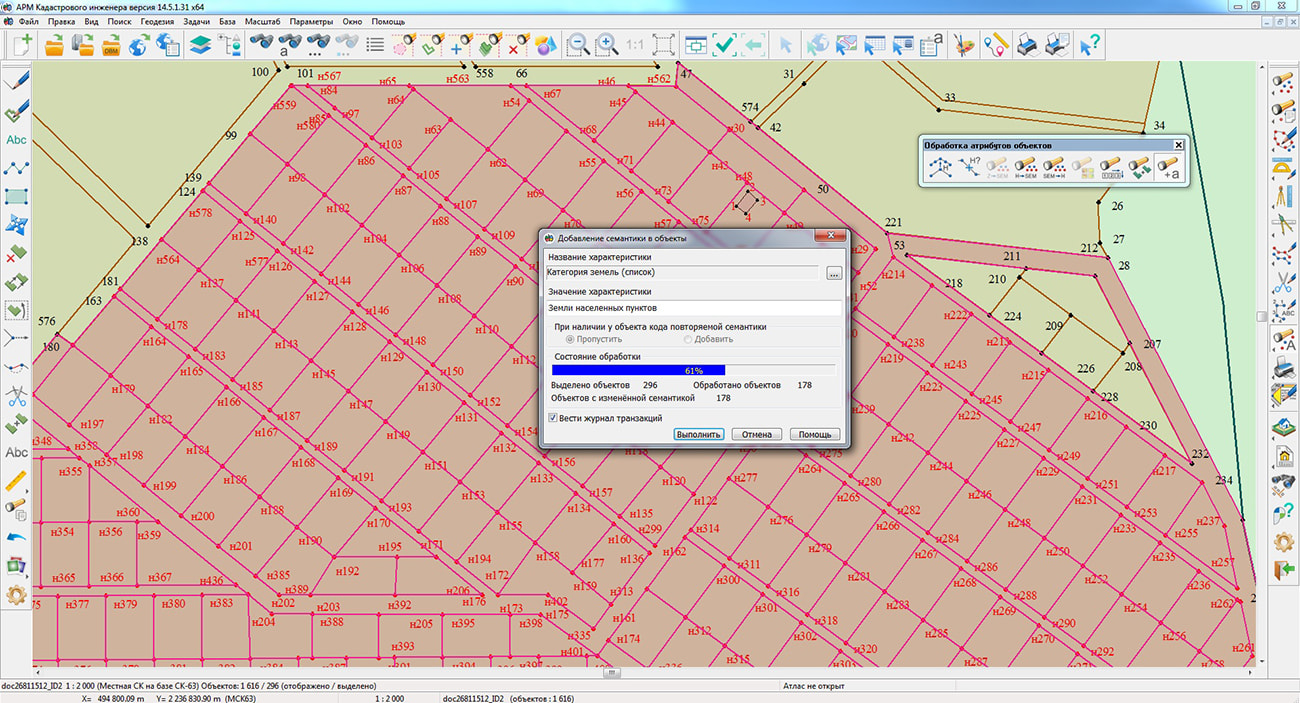
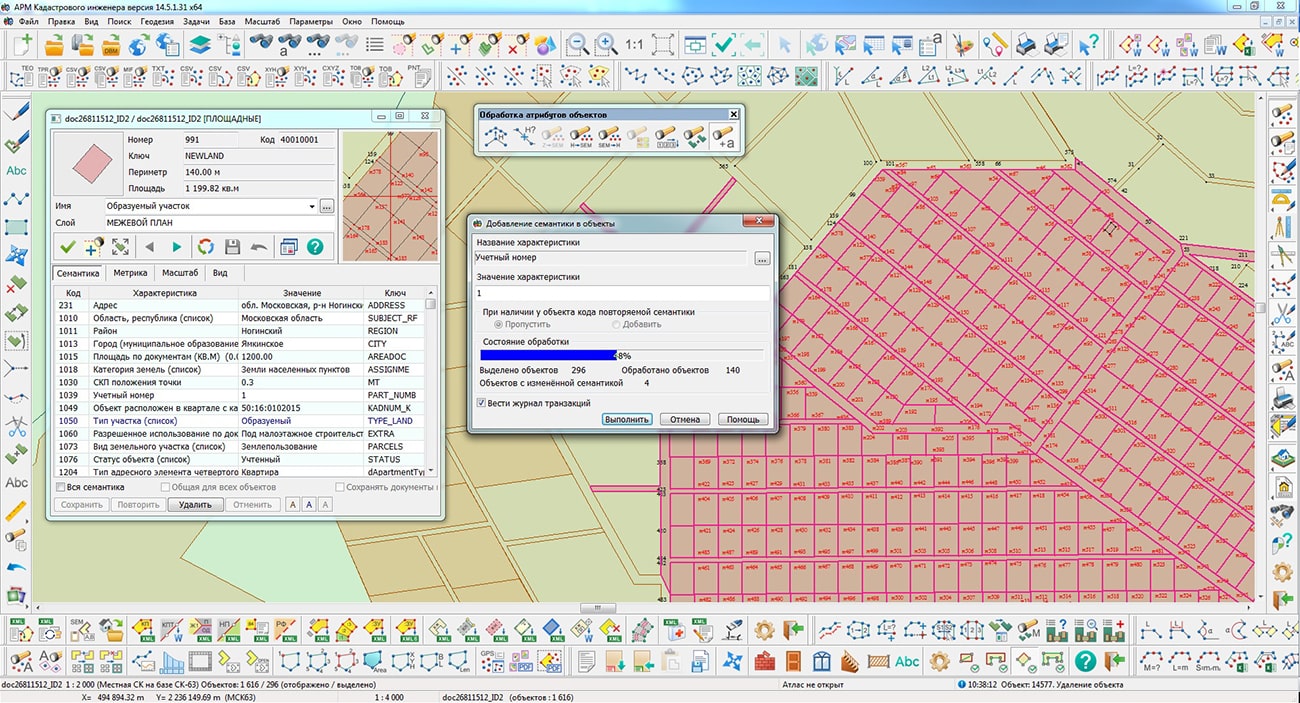
Specialists of KB "Panorama" have prepared the video tutorial on the operation of the mode "Adding semantics". Users of "Workstation of cadastral engineer", or can add semantics to objects using the tasks of the complex .
The mode "Adding semantics" is located on the subpanel " of the geodetic editor. The task is intended to add the value of semantic characteristic to the selected objects. It is necessary to select objects on the map, activate the mode "Adding semantics", specify the name and value of the added characteristic, and click "Execute".
The result of the mode operation is the filled in specified semantic characteristics. It is possible to be sure that the necessary semantic characteristics of the object are filled in using the mode (Object selection) or the mode of the panel of the complex "Geodetic editor".
It is possible to be acquainted with the training materials in the section "Video Tutorials".


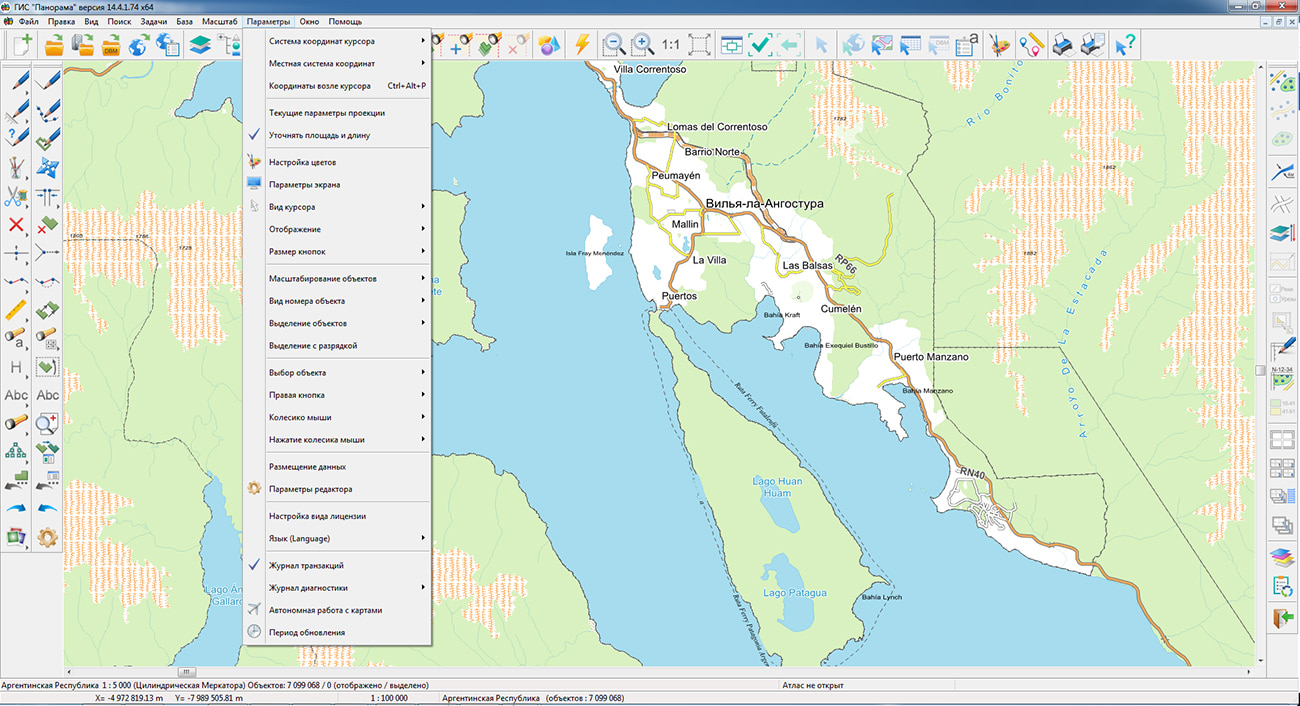
The geoportal is supplemented with a map of the Argentine Republic, formed according to data OpenStreetMap. To work with the map, it is possible to use the program or other software products of KB "Panorama".
The map is brought to the modernized classifier of large-scale plans on a scale of 1: 5,000 (map5000m). Updates were placed in the spatial data bank using the program . The contents publication of the spatial data bank on the geoportal and access to data for downloading are implemented by means of .
Free maps based on data OpenStreetMap are available for download on the page "Digital maps".


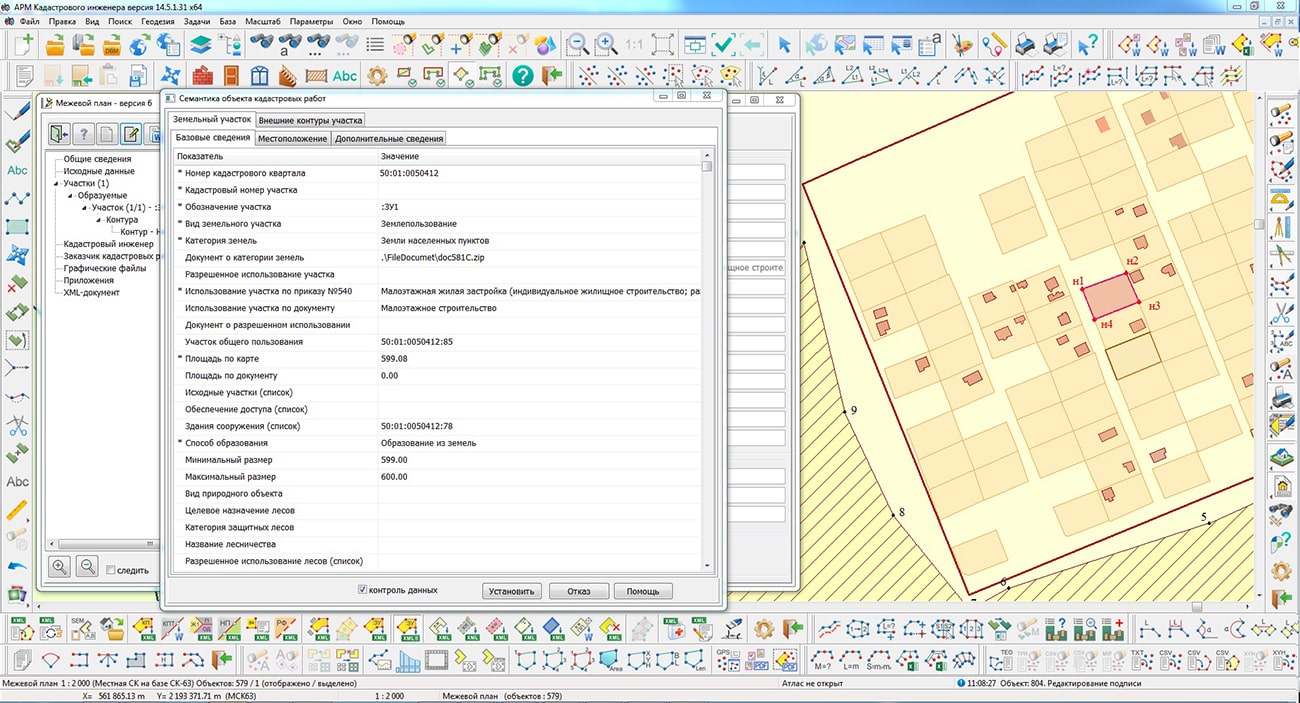
KB "Panorama" developed "Workstation of cadastral engineer" version 14.5.1. In the new version during creation a cadastral map using the mode the procedure for filling in identification semantics for isolated plots as part of a single land use has been updated for their use in the dialog . There are added reading and writing attributes to the semantics of real estate objects: "Status of a record about the real estate object", "Copyright holder(s)", "Type, number and date of state registration of rights".
In the mode there are plotted the characteristic points with taking into account the type of boundaries of the cadastral object. Drawing the point objects at the nodes of the municipalities boundaries and various zones, it is used the object "Characteristic point of boundaries" from the layer "Map-plan". Drawing points of buildings, structures and objects of unfinished construction is carried out with the conditional sign "Characteristic point of the contour OH". Loading points without Average Square Error value for land plots and their parts is carried out with the symbol "The characteristic point is existing one, the coordinates of which are determined with the error." For the characteristic points of all cadastral objects, there is added semantic "ID of the coordinate system" and the identification semantics of the cadastral object (cadastral or registry number, contour registration number). For characteristic points of land plots, it has been added semantics 1331 "Number of object part". There is added a record of the semantics for the points of the reference boundary network. There is fixed the data reading error for populating the composite semantics 1340 "Unregistered restrictions". The dialog "Semantics of the object for cadastral works" has been improved. There are added functions to automate the input of initial data from the cadastral map. If the object has semantics with the key KADNUM_K, its value is entered in the field "cadastral block number", and if it is absent there is called, the function for searching of the cadastral block and displaying in the corresponding dialog element the semantics with the cadastral block key KADNUM . For multi-contour plots, the input of the value "Area by document" for external contours and the calculation of the total area have been corrected. It is fixed rounding when calculating the area of a multi-contour plot. The areas of individual contours are first summed up and then rounded up to integer values.
The new mode "Adding semantics" has been added to the task. The dialog "Automatic completion of the semantics for selected objects" has been improved, there has been added the step of changing the initial number. In the dialog "Designing a plot with boundary lines", the boundary lines of each plot are formed in accordance with its points, taking into account the identification semantics of the cadastral object. In the dialog "Filling a report for the object", it has been added the filling of markers containing the calculated total area value. These markers are used in the templates "Forest Declaration". In the dialog "Signing the area and the name of the object", the length of the applied demarcation line has been corrected and it has been added the output of area measurement units.
The dialog has been improved. When filling in the report of the position
"Formulas used to calculate the maximum permissible error in determining the area of a land
plot", a new procedure was implemented for using the initial data. If the object (site) has
semantics with the key FORMALA_S, then the read value is used. If there is no semantics, the
value from the program settings specified in the dialog "Parameters for generating cadastral
documents" is used. When generating a printed form of the approval act for adjacent sections, the
output of the values for the method and date of notification, the details of the document for the
representative of the allied company, and the method of withdrawing objections have been
added. To support these functions, the survey classifier of versions 5 and 6 has been updated, in
which new semantics have been added: "Details of a document confirming the representative
authority"," Method and date of notification about the coordination for the location of
boundaries, "Method of removing objections regarding the location of boundaries." When
generating the file XML of the boundary plan in the section Survey for the element
TochnAreaParcels, the area value (Area element) is read for the entire multi-contour plot, and
not for one the first external contour. It is added saving to the element
GeopointOpredDescription of the file XML for the value from the field "Additional information
about the method of determining the coordinates". For this, in the classifier survey.v5 and v6,
there has been added the new semantics with the key METHOD_ADD. When forming the
section "Information on the performed measurements and calculations" to fill in information
about the methods for determining the coordinates and formulas for determining Average Square
Error of points, the identification semantics for the characteristic points of the boundaries are
used. When generating the file XML of the boundary plan, in the section ChangeParcel
"Information on changed land plots and their parts" of the element TransformationContours
"Contours of the multi-contour land plot, the transformation of which is being carried out", it is
implemented the analysis of information about the registration numbers of the external contours
MKU when performing cadastral work on the division of the plot.
In the mode , it has been added processing the method of forming a real estate
object and the output to the date of surveying the points of the geodetic base has been added to
the report. The template 02_techplan.dot has been updated, in which markers have been added to
display the date of the survey In the text report of the technical plan of
construction object in progress, the insert of section "Conclusion of the cadastral engineer" has been added.
The new version of the program is available on the website in the section Download.


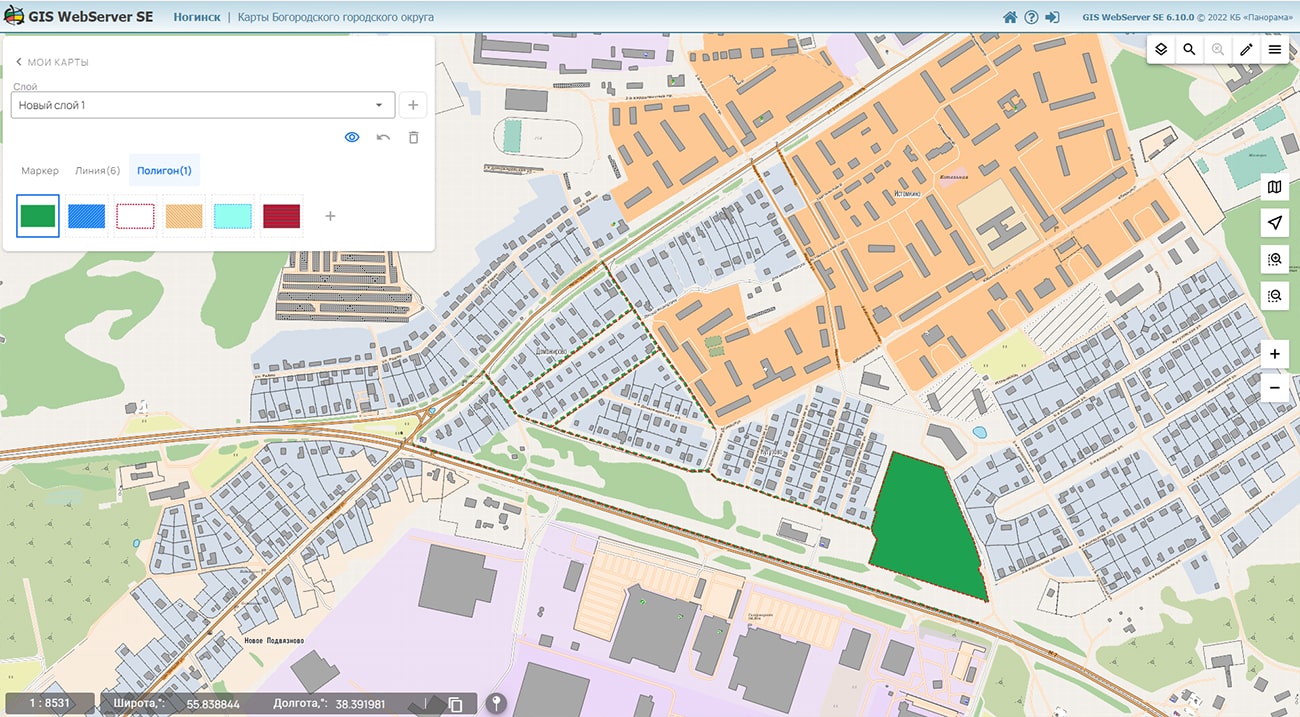
KB "Panorama" developed GIS WebServer SE version 6.10.0 for operating systems Astra Linux, CentOS, Ubuntu, MS Windows. The new version has improved data analysis tools, map editing and printing tools. The component My Maps has been added, the Map Printing and Map Objects components have been updated, and the administration module has been improved. The component My Maps is an online tool for creating infographics, the ability to systematize information about objects according to certain characteristics. The user can search and transform the displayed data, choosing what should be visualized and in which symbols. On the geoportals of regional or corporate GIS, using the mode My Maps, it is possible graphically express data on the state of engineering systems, on planned, repair or emergency work on roads or in networks, indicate driving directions, mark tourist places and places of events. The user's map is created on the selected objects and it is automatically saved on the server. It can be re-displayed, edited, printed or deleted. Markers, complex lines, polygons are applied in their own symbols. It is improved Print map mode. Information about map objects is displayed in the print document together with the map image. In the component Map Objects, it has been added the display of detailed information about map clusters and point objects aggregated into a cluster icon.
GIS WebServer SE is used to build closed corporate systems to ensure the protection of data classified as top secret or trade secret. The program is certified for level 2 of the lack of undeclared features. GIS WebServer SE is implemented using the toolkit , which can be used in development tools using JavaScript and TypeScript.
On the basis of GIS WebServer SE and (RGIS RR) is implemented. RGIS RR is a specialized multifunctional geoportal, the interactive capabilities of which provide access to reliable information about objects of various categories. RGIS RR is available to wide range of users - authorities, citizens, organizations, including potential investors and private companies. The regional GIS of Ryazan region helps in making decisions in various areas of socio-economic development. The new version of the program is posted on the website in the section .


Ph.: +7 (495) 739-0245, +7 (925) 221-1603
www.gisinfo.ru | panorama@gisinfo.ru
105005, Russia, Moscow, Baumanskaya Street 7, building 1, office 229 (m. Baumanskaya)
Copyright © Panorama Group 1991 - 2024


 Mobile version
 Full version