Copyright © Panorama Group 1991 - 2024

In KB "Panorama" the version 14.5.0 has been developed for creating GIS-applications. The new version has improved algorithms for displaying large amounts of data received from unmanned aerial vehicles in the component of displaying the 3D terrain model - TMap3DNavigator. The toolkit improves the speed of loading and displaying a point cloud from an MTD model created in the "Panorama Photo" program.
The program allows you to create high-precision digital terrain models in the form of clouds of points, matrixes of heights and orthophotomaps based on aerial photography from unmanned aerial vehicles. The cloud of points obtained in the "Panorama Photo" program contains point measurements sorted by blocks and by levels. Splitting into levels allows you to store points with spacing. On the first level, there are points with a step specified when creating the MTD model, on the second - with a step of 2 times more, on the third - 4 times more, and so on. In this case, points at different levels are not duplicated. This storage speeds up drawing of the 3D model by drawing blocks distant from the viewer with fewer points loaded from higher levels. The size of the cloud of points depends on the degree of the model's detail (density of points) and the area of the covered area. Displaying large MTD models requires significant hardware resources (RAM, video memory). In this case, the user can set up a filter of cloud of points to speed up drawing. Filter setting is available in the window of the TMap3DNavigator component in the menu "View" - "Filter of cloud of points". The filter determines the degree of thinning of the cloud of points during display: "Fine" - thinning by 2 times, "Average" - by 4 times, "Coarse" - by 8 times.
In the GIS ToolKit version, it became possible to use the under the standard license. Previously, when distributing applications developed on the basis of GIS ToolKit and including this component, the separate licence was required for execution of the user applications.
Technologies of KB "Panorama" allow displaying a conventional 2D map in a three-dimensional form, taking into account the characteristics of objects - number of storeys, wall material, and others. In this case, both the typical texture elements can be used - for example, all panel houses will look the same in 3D, and the individual 3D models of individual objects.
Three-dimensional terrain model in geoinformation products of KB "Panorama" is a surface built with taking into account the terrain, on which an image of a vector, raster or matrix map can be superimposed, and three-dimensional objects located on it, corresponding to objects of a two-dimensional map. It is a full-fledged 3D map that allows you to select objects on the model in order to request information about the object, edit their external view and characteristics. On the 3D model, both surface and underground objects can be seen.
Typical three-dimensional models are automatically created by 2D-maps: plans of cities, topographic maps or overview maps. For the three-dimensional models containing not typical 3D-objects, the view of such objects is customized individually. , , is carried out by means of the or .
The toolkit is a set of visual components, classes and API functions of the GIS core for full-fledged work with spatial data. The toolkit is designed to develop client-server and desktop 32-bit and 64-bit applications that require processing and visualization of spatial data. The GIS ToolKit classes and components are intended for use in the Embarcadero RAD Studio XE5 and higher programming environment (Delphi and C++ Builder) and are supplied with source codes. Components can be compared to "semi-finished products", using which you can quickly and easily develop your own geoinformation application. At the same time, the GIS core of the GIS ToolKit toolkit can be used not only in the Embarcadero environment, but in any development environment with any compiler that supports WINAPI standard function calls.
The new version of the program is available for download on the page.


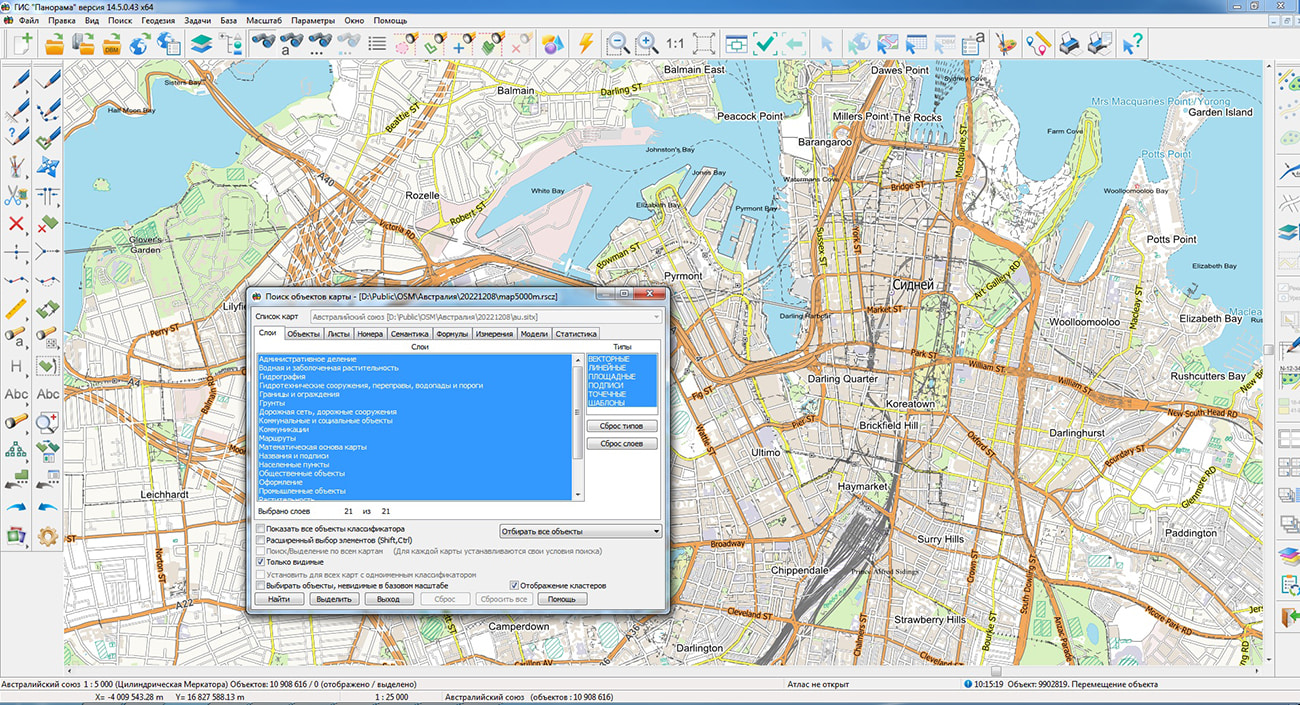
Geoportal has been supplemented with a map of Commonwealth of Australia, formed according to OpenStreetMap data. To work with the map, you can use the program or other software products of KB "Panorama".
The map was led to the modernised classifier of large-scale plans of scale 1: 5 000 (map5000m). Publishing of updates in bank of spatial data is made by using the program of . Publishing contents of bank of spatial data on the geoportal and data access for downloading are implemented by means of .
Free maps on the basis of OpenStreetMap data are available for download on the page "Digital maps".


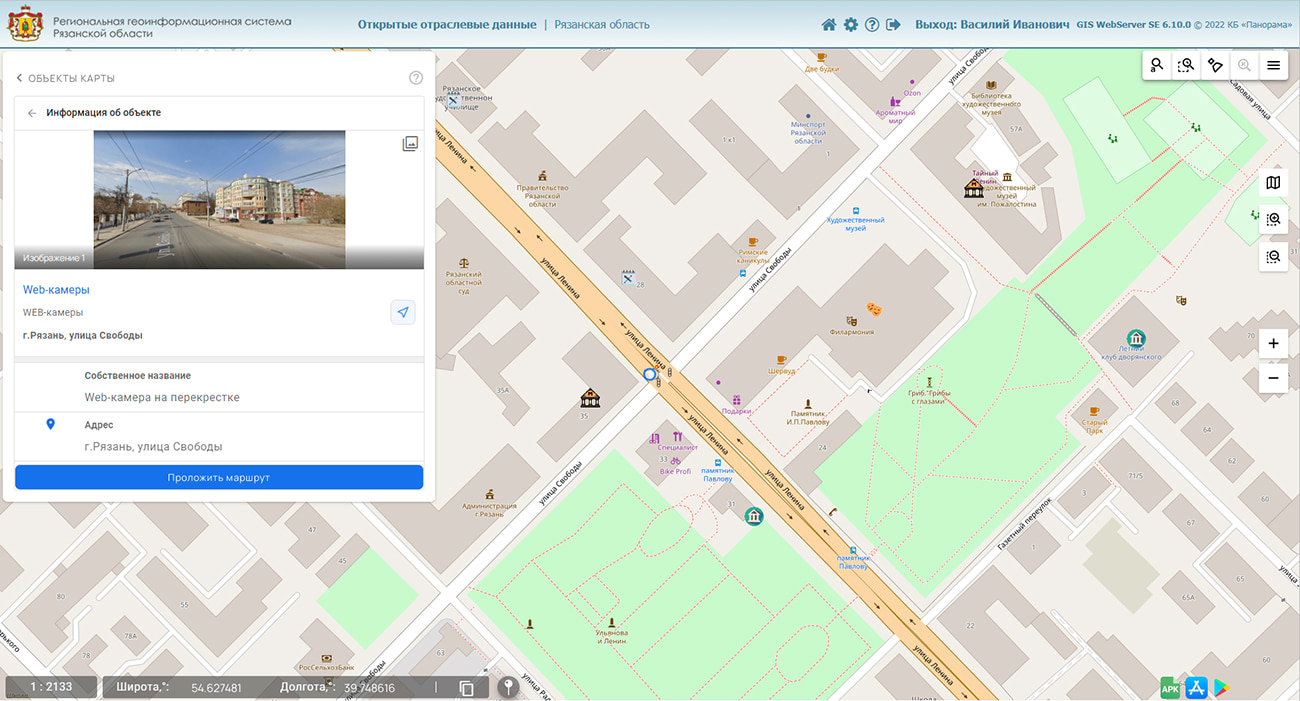
The software and the information support of the has been updated. RGIS RО is intended for placing, storage, actualization, the analysis and representation of spatial data coming into it from various sources. With a view of increase of efficiency of the RGIS RO operation processes, reduction of time for preparing interactive layers of a digital map and improvement of quality of data visualisation an updating of the interface solutions were made and a number of new geo-tools were added.
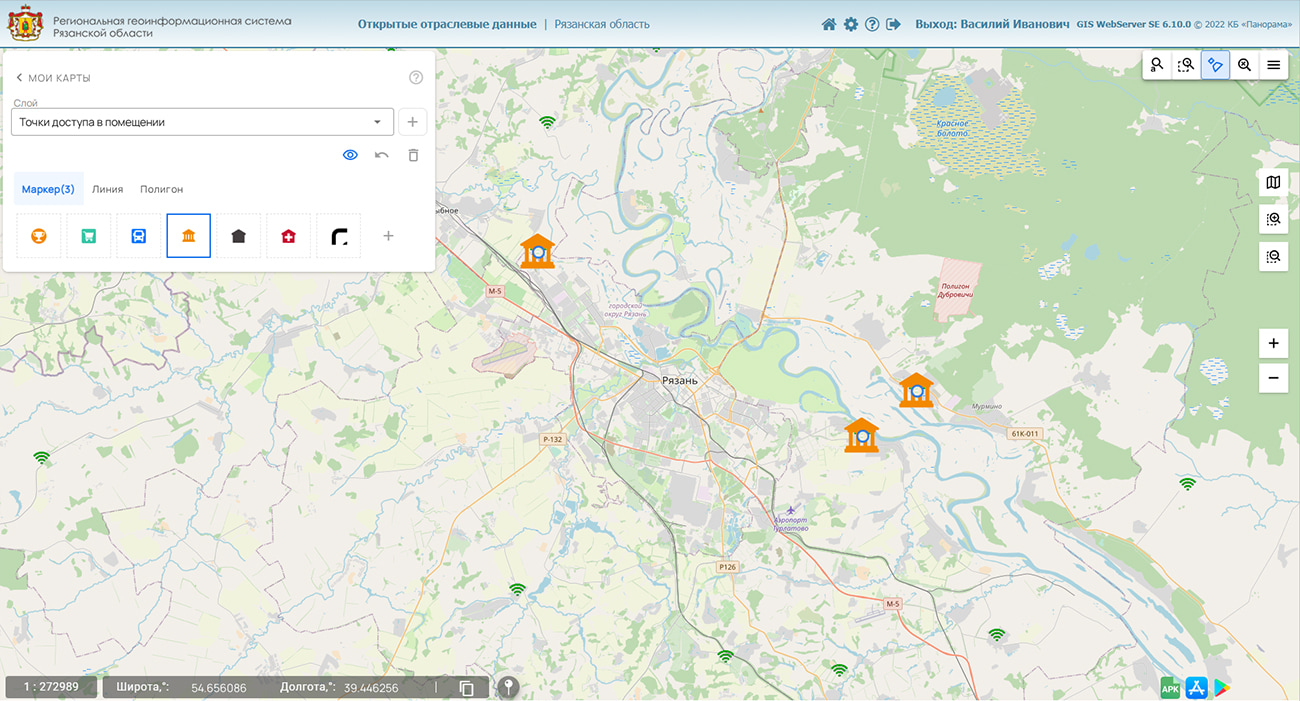
The component allows you to create map layers with objects of arbitrary graphical form. In the user's conventional symbols, markers, complex lines, and polygons can be placed on the map. For each type of objects (point, line, polygon) there is a set of preset views, which can be extended with the user's own conventional symbols.
Into dialog there is added a possibility to print the attributive information on objects together with a map, and also results of measurements (angles, distances) in a graphic form.
When you select a on the map, information about the number and type of objects included in its composition is displayed. Further, by pressing the button, the map is scaled to visualize the cluster objects and obtain detailed information on each object. Possibility to attach to the map objects of a photos has been added and to display them on the panel "Map objects" together with the attributive information.
The updated interface is built using the progressive JavaScript framework Vue.js and modern visual controls.
RGIS of the Ryazan region is used with a view of creation and providing the reliable official information about the Ryazan region, formation and integration of information resources about its territory, necessary for the exercise of powers and decision-making by state and municipal authorities of the Ryazan region. RGIS RO is built on the basis of the software package. The complex provides publication of digital cartographic information and Earth's remote sensing data (ERS), visualization of thematic information from databases, and generation of documents. An open API allows you to organize interaction with automated control systems, systems for monitoring the state of the area, transport management, providing urban planning tasks, maintaining a land and real estate cadastre, and others.
Software of the Complex of conducting a regional geoportal is included in the Register of Certified Information Security Tools and can be used to process information classified as "secret".
On our website you can find other materials on RGIS RO:
- In the Ryazan region, bees are protected with use of geoinformation technologies;
- GIS WebServer AGRO is presented at the webinar "Software and services in agro-industrial complex;
- Governor of the Ryazan region has highly appreciated development of Regional geoinformation system;
- RGIS of the Ryazan region is used in the state cadastral assessment;


In KB "Panorama" the has been developed. In the new version the possibility of requesting the information from databases of external information systems through web-protocols has been implemented, in the the task the tools of creating digital reports have been realised, tools for managing the palette of images and geoportals have been expanded. Import and export of DXF format and import DGN have been improved, the list of basic Python scripts has been supplemented, the and have been improved.
- "1C: Enterprise" and others, allows you to use data from these systems as additional attributive information for the displayed territory. For example, the information database "1C: Enterprise" contains information on accounting objects - land plots and buildings, their lease payments, terms of lease, types of permitted use and other indicators which can be displayed in the GIS "Panorama" in logic connection with objects of a vector map and/or a spatial database.
Access to external information systems is carried out using the HTTP protocol. The response from the system is a data set in XML format, which is provided to the user of the GIS "Panorama" in the form of a table in a separate dialog box. The dialog provides various interactive modes of operation: search on the map for an object corresponding to the current record, and vice versa - search for a record in the table for the current map object; setting filters for displaying data in the table with the ability to select objects on the map that meet the filter conditions; filtering records in the table by selected map objects; viewing the selected table record in a separate dialog box; export of the table into a file *.csv and others.
Link of records of a data set from an external source with objects of a map is carried out on conformity of value of a key field and predetermined semantics of object that is specified in the settings. For example, information on real estate objects in the 1C database can be associated with map objects by cadastral number.
On a web service, the data from the "1C:Enterprise" information database can be published in two ways: publishing a data set using a programmed HTTP-request handler and publishing regular resources of information database using the OData protocol. In the second case, a programming on the "1C:Enterprise" side is not required; data publication is enabled by a simple setting in the configuration of information database.
A map of land plots and buildings and a configuration of the "1C:Enterprise" information database containing information on these land plots and buildings have been added into the demo data included in the GIS "Panorama" installation. In a configuration of information base the publication by the OData protocol of directories has been prepared and the example of programed formation of the XML-response to a request to HTTP-service is contained.
The problem "Report Designer" is finished. Possibility of creation of the project with a background map instead of insert is added. The background map can be the project of the data or a separate vector map. For it restriction of area of display is established, and documents, illustrations, a legend of a map, insert of other maps from above are added. The background map in the report project allows to create the digital report, instead of paper. Unlike the maps placed in inserts, the background map is accessible to execution of queries, the decision of settlement problems, supports display of co-ordinates.
The "Report Designer" task has been improved. Added the ability to create a project with a background map instead of an inset. The background map can be a data project or a standalone vector map. For it, a limitation of the display area is set, and documents, illustrations, a map legend, insets of other maps are added on top. A background map in a report project allows you to create a digital report rather than a paper one. Unlike maps placed in insets, the background map is available for performing information requests, solving computational problems, and supports displaying coordinates.
The "Report Designer" task has been improved. Ability has been added to create a project with a background map instead of an inset. The background map can be a data project or a standalone vector map. For it, a limitation of the displaying area is set, and documents, illustrations, a map legend, insets of other maps are added on top of it. A background map in a report project allows you to create a digital report rather than a paper one. Unlike maps placed into insets, the background map is available for performing information requests, solving computational tasks, and supports a displaying coordinates.
The task has been improved. "Close contour" mode has been modified on "Metric" tab. If the first and last points of contour are located at a distance of more than 1 dm between each other, then one more point is added to close the contour of the object, otherwise coordinates of the first point are written to coordinates of the last point.
For the palette of raster images and geoportals, the "Saturation" parameter has been added with a range of values from -16 to 16. The initial state of the palette is set to 0. When the value increases, the color of the image (the degree of difference from gray) increases. Increasing the color of the image improves the quality of visual interpretation. Decreasing the value reduces the color of the image. At the minimum value, the bitmap image becomes gray grayscale. Lowering the color of an image allows you to prepare it as a background image. The background image can be used for drawing applied objects of the user map.
In the tasks of and of data into DXF format a saving and reading the colors of the conventional symbols of objects in the RGB format has been implemented. The RGB color model covers a larger range of colors and provides maximum color accuracy compared to the previously used indexed color of the AutoCAD palette. Into the "Export a map to DXF file" dialog, the ability to customize the processing of all open maps has been added when the "Process all maps" option is enabled, that allows you to automatically export the data of each map to a separate DXF file. In the task, the possibility of creating objects that are described in the source file as a complex chain is implemented. As a result, the elements of each chain are transformed into a single object. The dialog interface has been updated in order to automatically process a set of selected data and create a separate user map for each DGN file.
There is added a support for service semantics 31013 "Background color of polygon or signature" for labels. When adding to object of title type of semantics 31013 a color of a background of the title will be displayed according to the value specified in semantics in RGB format. Semantics can be added in object through the "Select Object" dialog, through the semantics editing modes of selected objects in the "Map Editor" task or in other tasks.
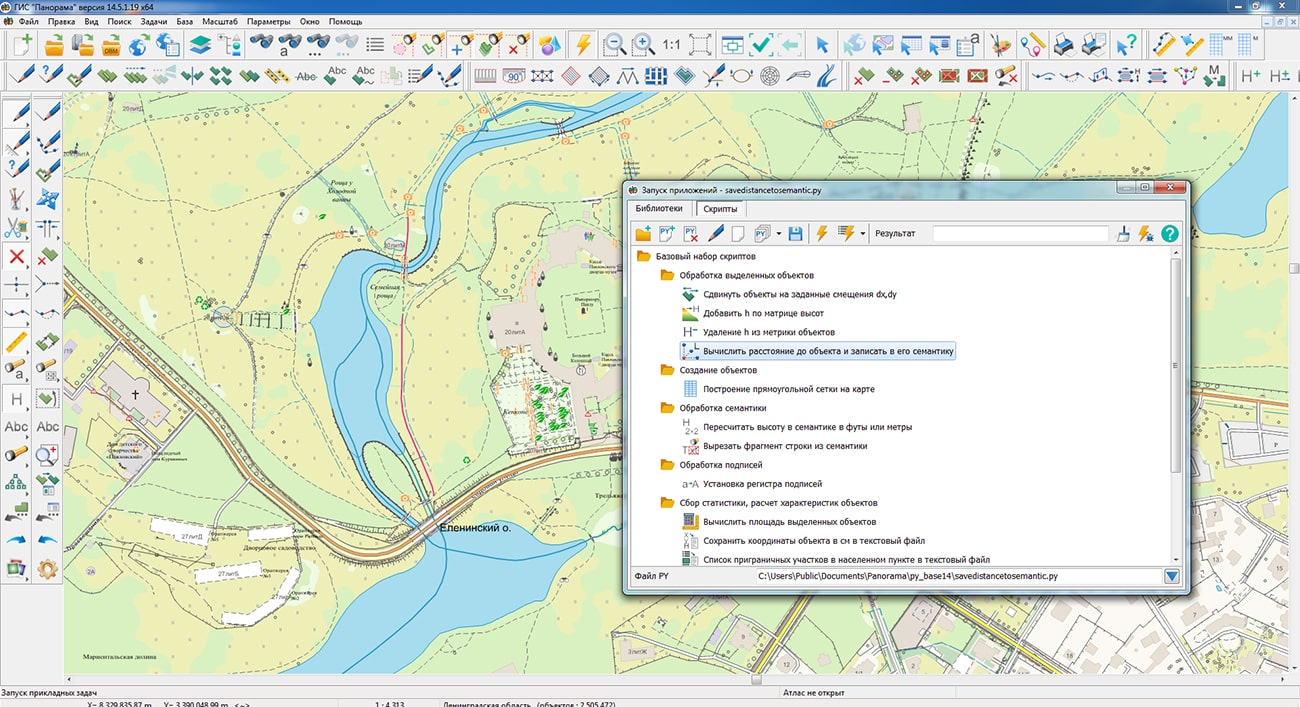
The script has been added into the list of basic python scripts. To execute the script, it is necessary to select objects on the map, specify the object to which the distances from the selected objects will be calculated, and call the script through the menu Tools\Run Application, Scripts tab. In the dialog, you need to select the semantics into which the distance to the specified object will be recorded for each selected object, and click the Run button. For general information on writing and debugging scripts, see Help.
In the "Geodesy editor" task, the formation of the "Forest declaration" has been improved. For the correct filling of Annex 5 to the forest declaration, the procedure for displaying the total area of the object (cutting area) and the area according to documents has been corrected. Forced conversion of PDF file to EMF has been added.
In the "Complex of cadastral tasks" in the "Create objects from an XML file of the cadastre" mode, a new procedure for filling in identification semantics for isolated plots as part of the EZP - single land use has been implemented. In the "Semantics of the object of cadastral works" dialog, functions have been added to automate the input of initial data. If the object has the KADNUM_K semantics, its value is displayed into the field "cadastral number of quarter", and if it is absent, the function of searching for the cadastral quarter and displaying the cadastral quarter into the corresponding element of the KADNUM semantics dialog is called. The rounding is corrected at calculation of the area of a multicontour plot. The areas of individual contours are first summed up and then rounded up to integer values. When generating a printed form of the approval act for adjacent sections, the output of the values of the method and date of notification, the details of the document of the representative of the allied company, and the method of removing objections have been added. To support these functions, the survey classifier versions 5 and 6 have been updated, in which the new semantics have been added: "Details of the document confirming the authority of the representative - DOCTRASTED", "Method and date of notification of the coordination of the location of boundaries - NOTIFICATION", "Method of removing objections regarding the location of boundaries - OBJECTION". For the correct filling of the Act, the semantics "Copyright holder" (LANDHOLDER), "Type of right" (PRAVO) and "Document of the copyright holder" (DOCHOLDER) must be filled by using the "Semantics of the object of cadastral works" dialog, on the "Additional information" page. In the "Technical plan" dialog, processing of the mode of forming a real estate object has been added and the output of the date of inspection of geodetic base points has been added into the report. The template 02_techplan.dot has been updated, in which markers have been added to display the date of the inspection.
The new version of the program is available for download on the page.


Specialists of KB "Panorama" have prepared a video lesson on working the mode. Users of the "Workstation of cadastral engineer", GIS "Panorama" or "Panorama-editor" can unite the polygonal objects using the tasks of the complex.
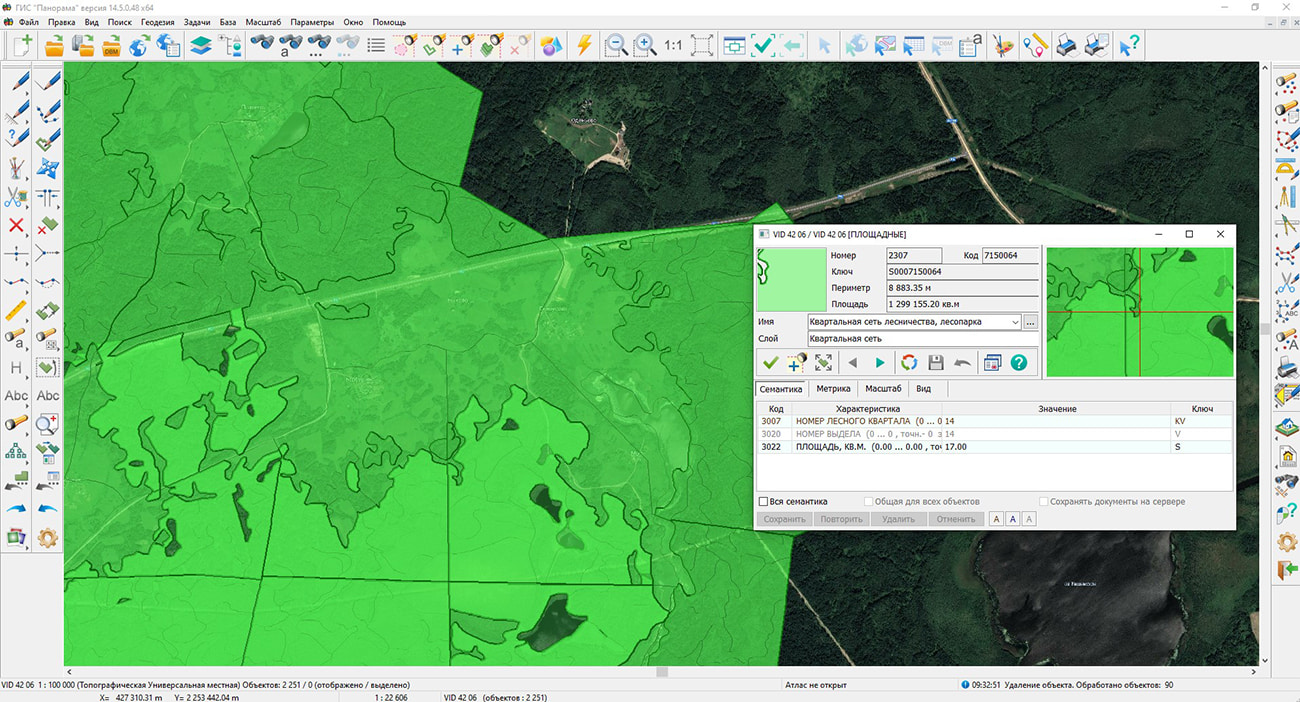
The mode is intended for uniting the areal objects at which semantic values coincide. For example, to automate the process of uniting the forest inventory allotments into forest blocks. The mode provides stream processing of map objects that have adjacent boundaries and the same attribute values. In this case, only areal objects of the type specified in the dialog, located on one map sheet, are processed. The result of the work are newly created objects.
Before using the "Union of objects" mode, you need to make sure that the data is correct. To do this, users of the GIS "Panorama" or "Panorama-editor" can check the structural integrity of digital data, the completeness and quality of the metric and semantic description of objects and perform automatic correction of detected errors. The task can work in two modes: checking the data and editing the data. In more details the mode work is considered in a training video on checking the quality of a vector map in the GIS "Panorama".
Creation and editing of objects on the map is carried out with the help of the applied task . The editor of a vector map is controlled with the help of the control panel placed when starting in the left part of the main program window. The control panel of the vector map editor can have a standard view (users of the "Workstation of cadastral engineer") or a professional view (users of the GIS "Panorama" or "Panorama-editor"). The standard panel of the map editor includes the minimum set of modes of creation and editing of objects of a digital vector map. The professional panel of the map editor represents the expanded variant of the standard panel and includes a number of modes providing additional service for creating digital vector maps "from zero".
You can get acquainted with the training materials in the "Video lessons" section.

Ph.: +7 (495) 739-0245, +7 (925) 221-1603
www.gisinfo.ru | panorama@gisinfo.ru
105005, Russia, Moscow, Baumanskaya Street 7, building 1, office 229 (m. Baumanskaya)
Copyright © Panorama Group 1991 - 2024


 Mobile version
 Full version