Copyright © Panorama Group 1991 - 2024

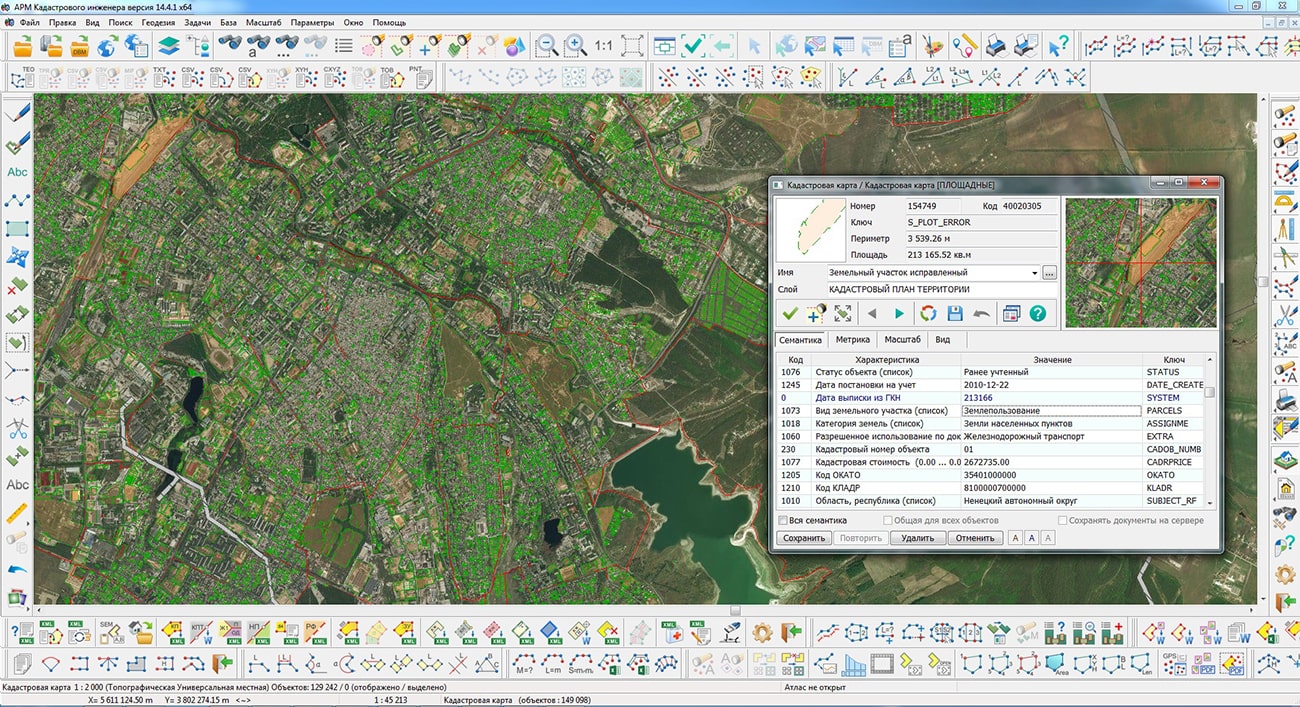
In KB "Panorama" the "Workstation of cadastral engineer" versions 14.4.1 has been developed. In the new version, in the dialog of the mode "Correction of registry errors", the possibility of generating an XML file according to the scheme ReportRegistryError_v01.xsd has been added. Procedure for changing in the Unified State Register of Real Estate of information about location of the boundaries when correcting a registry error was approved by order of Rosreestr dated 01.06.2021 No. P/0241. The form and content of the Report on the results of determining the coordinates of the characteristic points of the boundaries and the area of cadastral objects in order to correct registry errors are given in Appendix 4 to the order.
A report in XML format includes a package of information, source data, a boundary scheme, and other information necessary to correct registry errors. The information package includes the following elements: SpecifyParcels - Information about the location of the boundaries and area of land plots, parts of land plots; AdditionalParcels - Information about land plots, the location of which is determined additionally; RealtyRegistryError - Information about the location of buildings, constructions, objects of under construction and BoundariesRegistryError - Information about the location of the boundaries (parts of the boundaries) of municipalities, settlements, territorial zones, forestries.
The XML file is created according to the prepared cadastral map, onto which the existing and corrected objects should be applied using the survey.v6.rsc classifier, the "Correction of registry errors" layer. When written in XML, multiplanimetric objects can be represented as multipolygons or sets of objects. Establishing a correspondence between the existing and corrected contours of cadastral objects is carried out using the cadastral and registry numbers of objects and registration numbers of contours. The assignment of a cadastral object into the required section of an electronic document is performed by the type of object and with semantics use. For land plots - "Sign of correction". For the boundaries of a municipality, settlement, territorial zone, forestry - "Type of object of the registry of boundaries" and "Type of description of the boundary".
The new version of the program is available on the website in the Download section.


In KB "Panorama" the version 14.2.3 has been developed for OS "Astra Linux Special Edition" (Release "Smolensk") and OS "Alt 8 SP" (architecture x86-64). In the new version a saving the digital maps in vector PDF format has been implemented, tools for displaying maps and terrain images have been improved, new possibilities for importing files of exchange formats SHP, MIF, KML, GML are added, tools for setting up the display of map objects in the classifier of conventional symbol have been improved.
In the program the saving of digital maps into a file of vector format PDF has been added. Due to the fact that the vector PDF format preserves the display quality at any display scale, the new mode can be used in the process of preparing reporting documents. For example, a user can combine a set of open maps, save them in vector PDF format, and transfer the resulting file for viewing in original quality at any scale using standard operating system tools. The new mode allows you to save the entire map or only the required fragment according to a rectangular fragment, object, or the size of the current window. Printing is performed at an arbitrary scale: for example, the user can select a map fragment at a small scale, and output it to a file at a larger one.
Display of rasters with smoothing has been added. At increasing the image of a raster more than in two times from the initial size in pixels the smoothing is carried out. The new algorithm of display allows to get rid of "pixelization" effect when you increase the rasters. Image smoothing is performed by bicubic interpolation method (by 16 nearest raster elements). Smoothing is enabled or disabled via the main menu: "View" - "Raster smoothing".
Abilities of displaying titles have been expanded. New properties of design the titles allow to mark the title by a shade, outline, a background and a frame, and also to format the text taking into account a spacing sign (an insert of spaces) and the chosen register (uppercase, lowercase, as in a sentence). There is added the ability to change the thickness of solid and dashed contours of objects by the value of the service semantics "Line thickness in mm" (31005).
Possibilities of applying user semantics have been expanded for recording arbitrary object properties which are not described in the list of semantics of RSC classifier. User semantics are created when importing vector data (SHP, KML, MIF and others), when the field names (keys) of object attributes are not found in the selected RSC classifier. To support such semantics, temporary semantics are created in the RSC classifier in the range of codes 660000 and higher for the duration of a GIS session. Semantics name is filled by name of fields in the source vector data. When simultaneous opening several maps with one classifier, the list of temporary semantics will be supplemented with user semantics from all maps. When opening different combinations of maps, temporary codes in different sessions may have different values. When exporting vector maps to SXF and TXF files, user semantics is written with code 32862 and data record of the form "field_name:value". When imported, such semantics are transfered back into temporary semantics with the addition of new code to RSC. On the map, semantics are written with codes in the range from 60000 and above. The correspondence between the semantics code on the map and the field name is stored in the map metadata. When opening a map by the list of field names of user semantics, temporal semantics are automatically added into RSC.
In the "Classifier editor" task, tools for the description of clusters, formations of XSD-scheme by the classifier and editing of a layer's external view have been added. When grouping more than one object of a given type in a virtual cell of a cluster, their conventional symbols will be automatically replaced by a symbol of the cluster, the center of which will have the average coordinate of the objects included into it. When you change the scale, the configuration of the clusters automatically changes. The conventional sign of the cluster can be programmable, which allows you to select the type of cluster in various ways and change the properties of the sign depending on the number of objects in the cluster (signature of the number, size of the sign, brightness). In this case, the cluster icon can contain only the number of objects or other complementary elements of the conventional symbol. When drawing an object, various semantics can be taken into account, including links to graphic files, which makes the generalized sign more complex and informative. Maps with clusters customized in the RSC classifier are automatically supported in all desktop and web applications, as well as in applications developed in the and .
Possibility of editing primitives "Table", "Line-colorglass" and "Cross polygon" has been added. The "Table" display type can be assigned to a point object that has a reference to CSV file in its semantics. Each column of the table can contain textual and numerical data, pictures (in PNG, JPG, BMP format), colored shapes and percentage scales. A table can have multiple pages. The map with the created tables will have one view in desktop, mobile, web-applications on any platforms, with local placement or on the and at printing. For the"Line - colored glass" and "Hatched polygon" views, the user can customize in addition to the color and thickness of the displayed lines, additionally the brightness, contrast and transparency. Arbitrary thickness and shift of ordinary lines or lines - colorglass are set as polygon hatching parameters.
GIS Panorama Mini is the universal geoinformation system intended for a collecting the spatial data, a conducting the spatial database, creation and updating of digital maps and plans, creation of information systems of various purposes. The program implements the following main functions: import and viewing of vector maps, raster data, matrixes of heights, matrixes of qualities, geological matrixes of layers, TIN-models, laser scanning data, user maps and work regions; creation of new maps with automatic filling of parameters using the EPSG code or from the list of parameters in XML format; export of maps to SXF, DXF, OGC GML formats; multi-user work with data with access control through a connection to the GIS Server; combining and editing vector maps of different projections in one document; support for popular geoportals, which allows displaying user maps over images received from sites; printing to various output devices with customization of print parameters.
The new version of the program is available for download in the Download section.


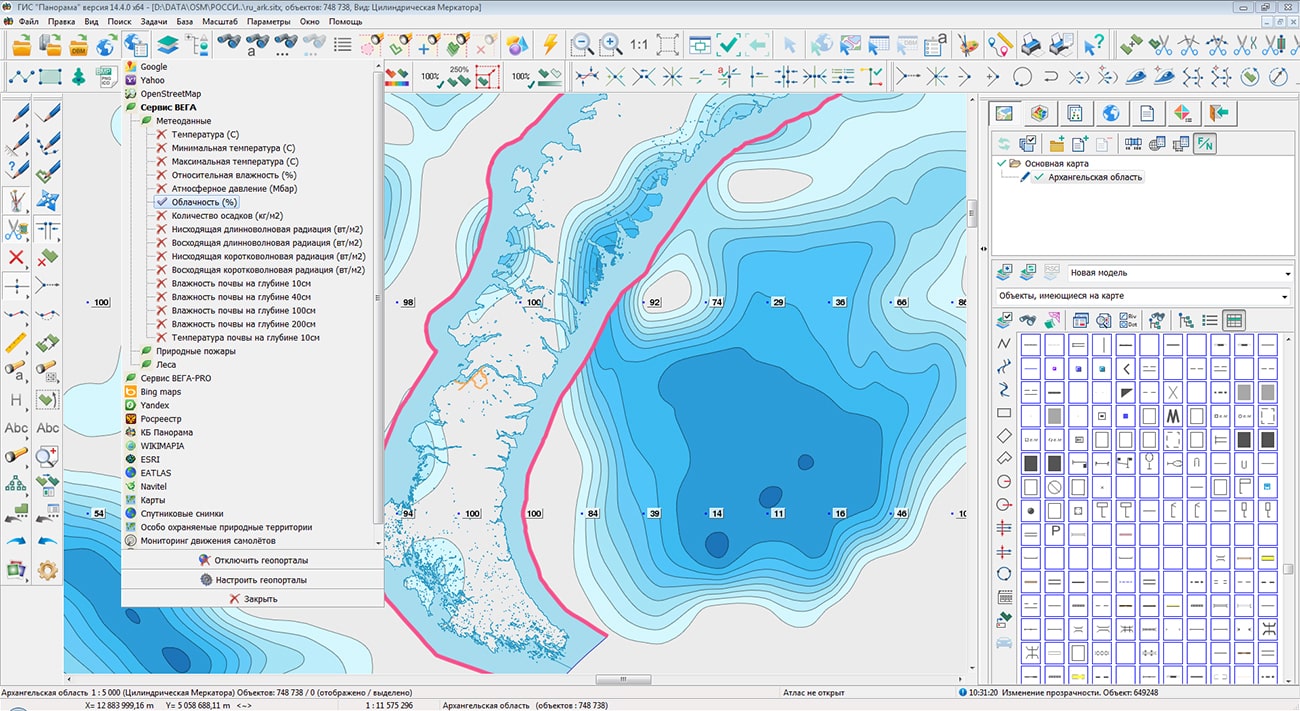
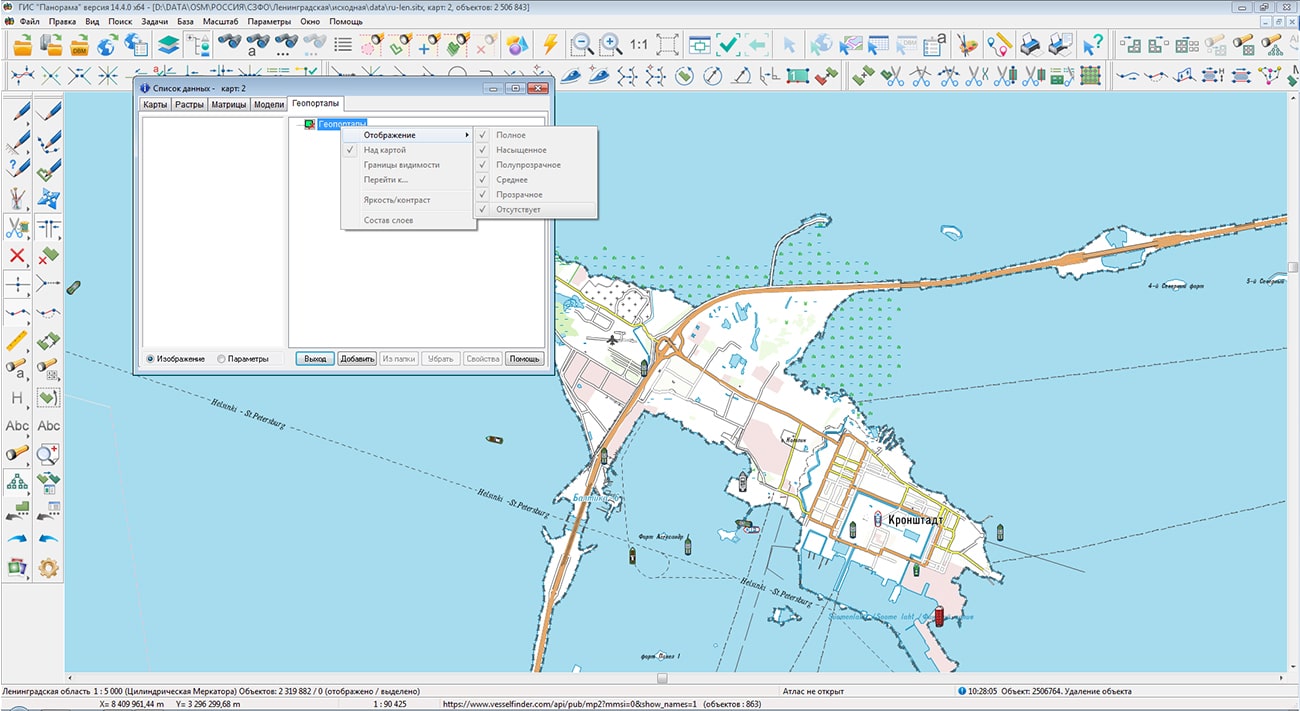
Specialists of KB "Panorama" prepared and posted on the geoportal maps of the Leningrad and Arkhangelsk regions. Maps have been formed according to OpenStreetMap data. To work with maps, you can use the program or other software products of KB "Panorama".
The maps were led to the modernised classifier of large-scale plans of scale 1: 5 000 (map5000m) and saved to a packaged project (MPTZ). Publishing of updates in bank of spatial data is made by using the program of . Publishing contents of bank of spatial data on the geoportal and data access for downloading are implemented by means of .
Free maps on the basis of OpenStreetMap data are available for download on the page "Digital maps".


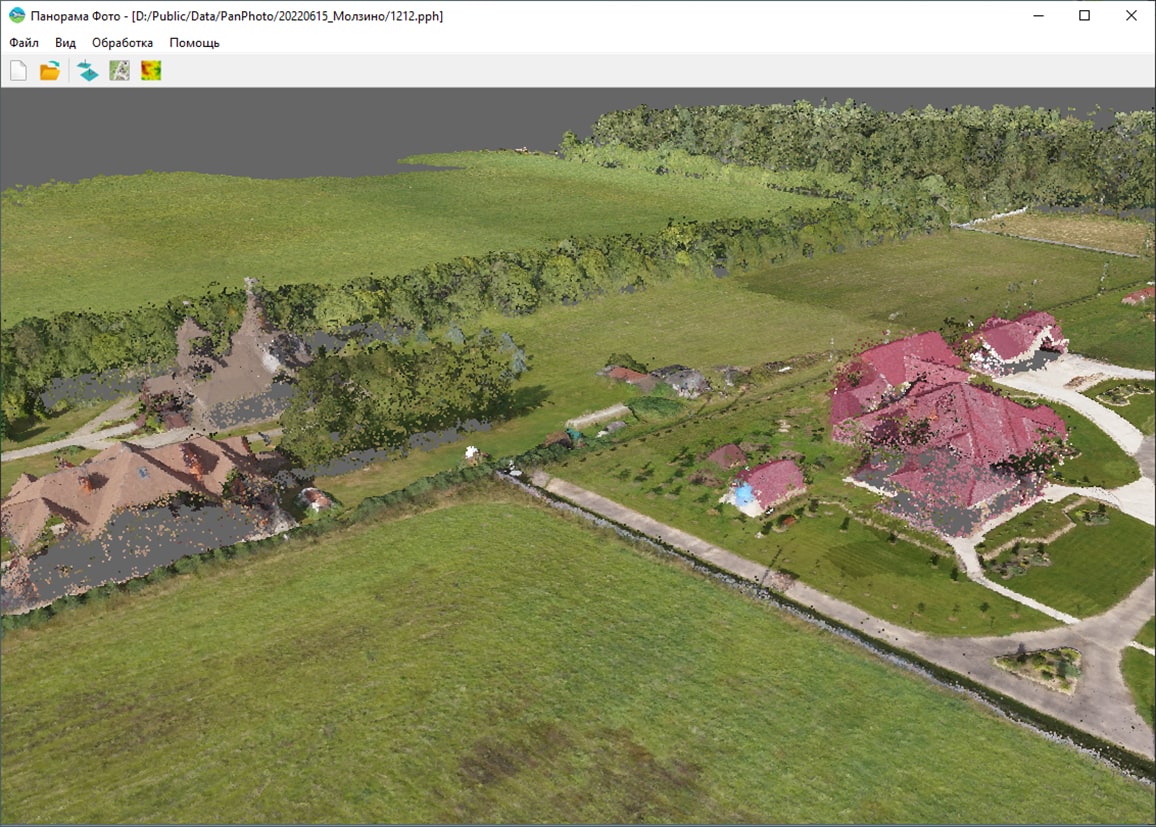
In KB "Panorama" the program has been developed for creating high-precision digital terrain models in the form of a cloud of points, matrixes of heights and orthophotomaps based on aerial photography from unmanned aerial vehicles. The processing process is fully automatic. The optional stage of measurement of support points on photos allows to increase the accuracy of orientation. Calculations are parallelized on a multi-core processor and video card, so an increase in the number of processor cores and video memory significantly speeds up the data processing process. On a computer with a modern video card and 128 GB of RAM for 1 sq. km of aerial photography with a dot size of about 2 cm, obtaining a three-dimensional model, a matrix of heights and orthophotomap takes within 1 hour.
"Panorama Photo" allows you to solve problems in the field of urban planning and cadastral activities, national defense, mapping, ecology, forestry and municipal services, and others. The data generated in "Panorama Photo" are used as a reliable and visual control tool in the construction and reconstruction of various types of municipal property and transport infrastructure. On the basis of data prepared by the complex, the three-dimensional terrain models are created, construction and analysis of mathematical models of emergency situations in the is carried out.
Orthophotomaps created in "Panorama Photo" are the basis for identifying and monitoring the places of storage of various types of waste, conducting an inventory of forests to assess damage from fires, air pollution and illegal logging.
"Panorama Photo" is an independent software package and does not require installation of additional components. Ease of learning and a convenient graphical interface will allow the user to quickly start working in the program.
To evaluate the product, you can use the program for free for 30 days. You can get acquainted with the "Panorama Photo" complex on the website in the section.


In KB "Panorama" the version 14.2.3 has been developed for OS "Astra Linux Special Edition" (Release "Smolensk") and OS "Alt 8 SP" (architecture x86-64). In the new version the possibility of creation, updating and analysis of digital terrain models by including into the software has been implemented. The tools for editing the classifier of conventional symbols have been improved, saving the digital maps in vector PDF format has been implemented, tools for displaying maps and terrain images, tools for importing files of exchange formats S57, SHP, MIF, KML, GML have been improved.
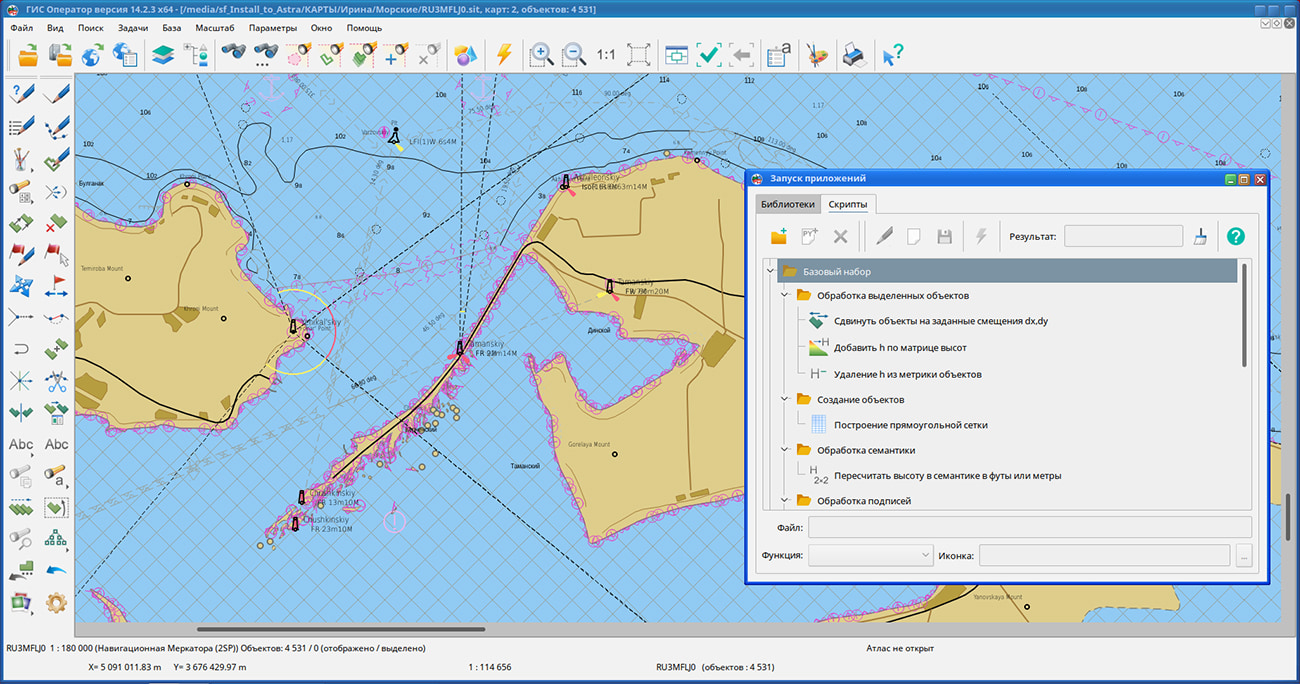
To solve diverse tasks of processing spatial data, the start of Python scripts has been added into the "Run application" mode. The mode initially contains a basic set of scripts for demonstrating the execution of various procedures for processing the coordinates and attributes of objects of vector maps, solving computational problems, converting data and other tasks. To connect his own tasks, the user can create his own themes and fill them with the necessary set of scripts. For the convenience of the user, the creation of a new script and its editing can be performed directly from the dialog. When writing scripts, several thousand GIS core functions (MAPAPI) are available. Function prototypes are declared as imported Python scripts from the folder /var/Panorama/Panorama14/py_mapapi14. The function called from the script performs some autonomous action or uses the selected objects on the map. To enter additional data processing parameters, both GIS dialogs and dialogs written on the basis of a standard Tkinter component can be called. Scripts indicate the progress of data processing by indicating the name of the processing stage and the percentage of completion in the main application window. By results of the analysis and processing the objects of a vector map can be selected and used for the further processing in a chain of executed scripts or interactive application tools. Scripts can be preliminarily prepared in a text editor, which is part of the operating system, and then be started by means of the task from the GIS "Operator". Because the Python scripting programming language has a large set of connected modules, the user receives an easy-to-use and extensive auxiliary toolkit (mathematical calculations, processing of text and graphic data, work with a network and another).
Saving of digital maps into a file of vector format PDF has been added. Due to the fact that the vector PDF format preserves the display quality at any display scale, the new mode can be used in the process of preparing reporting documents. For example, a user can combine a set of open maps, save them in vector PDF format, and transfer the resulting file for viewing in original quality at any scale using standard operating system tools. The new mode allows you to save the entire map or only the required fragment according to a rectangular fragment, object, or the size of the current window. Printing is performed at an arbitrary scale: for example, the user can select a map fragment at a small scale, and output it to a file at a larger one. Display of rasters with smoothing has been added. At increasing the image of a raster more than in two times from the initial size in pixels the smoothing is carried out. The new algorithm of display allows to get rid of "pixelization" effect when you increase the rasters. Image smoothing is performed by bicubic interpolation method (by 16 nearest raster elements). Smoothing is enabled or disabled via the main menu: "View" - "Raster smoothing".
In the "Classifier editor" task, tools for the description of clusters, formations of XSD-scheme by the classifier and editing of a layer's external view have been added. When grouping more than one object of a given type in a virtual cell of a cluster, their conventional symbols will be automatically replaced by a symbol of the cluster, the center of which will have the average coordinate of the objects included into it. When you change the scale, the configuration of the clusters automatically changes. The conventional sign of the cluster can be programmable, which allows you to select the type of cluster in various ways and change the properties of the sign depending on the number of objects in the cluster (signature of the number, size of the sign, brightness). In this case, the cluster icon can contain only the number of objects or other complementary elements of the conventional symbol. When drawing an object, various semantics can be taken into account, including links to graphic files, which makes the generalized sign more complex and informative. Maps with clusters customized in the RSC classifier are automatically supported in all desktop and web applications, as well as in applications developed in the and .
Possibility of editing primitives "Table", "Line-colorglass" and "Cross polygon" has been added. The "Table" display type can be assigned to a point object that has a reference to CSV file in its semantics. Each column of the table can contain textual and numerical data, pictures (in PNG, JPG, BMP format), colored shapes and percentage scales. A table can have multiple pages.
The map with the created tables will have one view in desktop, mobile, web-applications on any platforms, with local placement or on the GIS Server and at printing. For the"Line - colored glass" and "Hatched polygon" views, the user can customize in addition to the color and thickness of the displayed lines, additionally the brightness, contrast and transparency.
Abilities of displaying titles have been expanded. New properties of design the titles allow to mark the title by a shade, outline, a background and a frame, and also to format the text taking into account a spacing sign (an insert of spaces) and the chosen register (uppercase, lowercase, as in a sentence). There is added the ability to change the thickness of solid and dashed contours of objects by the value of the service semantics "Line thickness in mm" (31005).
Possibilities of applying user semantics have been expanded for recording arbitrary object properties which are not described in the list of semantics of RSC classifier. User semantics are created when importing vector data (SHP, KML, MIF and others), when the field names (keys) of object attributes are not found in the selected RSC classifier. To support such semantics, temporary semantics are created in the RSC classifier in the range of codes 660000 and higher for the duration of a GIS session. Semantics name is filled by name of fields in the source vector data. When simultaneous opening several maps with one classifier, the list of temporary semantics will be supplemented with user semantics from all maps. When opening different combinations of maps, temporary codes in different sessions may have different values. When exporting vector maps to SXF and TXF files, user semantics is written with code 32862 and data record of the form "field_name:value". When imported, such semantics are transfered back into temporary semantics with the addition of new code to RSC. On the map, semantics are written with codes in the range from 60000 and above. The correspondence between the semantics code on the map and the field name is stored in the map metadata. When opening a map by the list of field names of user semantics, temporal semantics are automatically added into RSC.
Support of XML files having the size more than 4 GB has been added. Processing of XML format is used in a wide range of applications (for example, importing data in GML format). The digital classifier of sea maps S57navy.rsc and the procedure for importing digital maps of the S57 standard have been improved to increase the degree of compliance of the displayed maps with the S52 standard.
GIS "Operator" SE - universal domestic geoinformation system for power structures. The program is designed for accumulation, storage, the automated processing and display of data, calculation results and forecasts with geospatial reference. GIS "Operator" contains tools of displaying and processing vector, raster and matrix maps. The application provides users with tools for solving specialized tasks of modeling the movement of special objects against the background of 3D model, forecasting of consequences of emergencies at hazardous objects, monitoring of aircraft movement, conducting of geodetic and topographic work, processing the data from GPS/GLONASS navigation devices, printing the displayed spatial data to various output devices and many others.
The new version of the program is available for download in the Download section.


Ph.: +7 (495) 739-0245, +7 (925) 221-1603
www.gisinfo.ru | panorama@gisinfo.ru
105005, Russia, Moscow, Baumanskaya Street 7, building 1, office 229 (m. Baumanskaya)
Copyright © Panorama Group 1991 - 2024


 Mobile version
 Full version