Copyright © Panorama Group 1991 - 2024

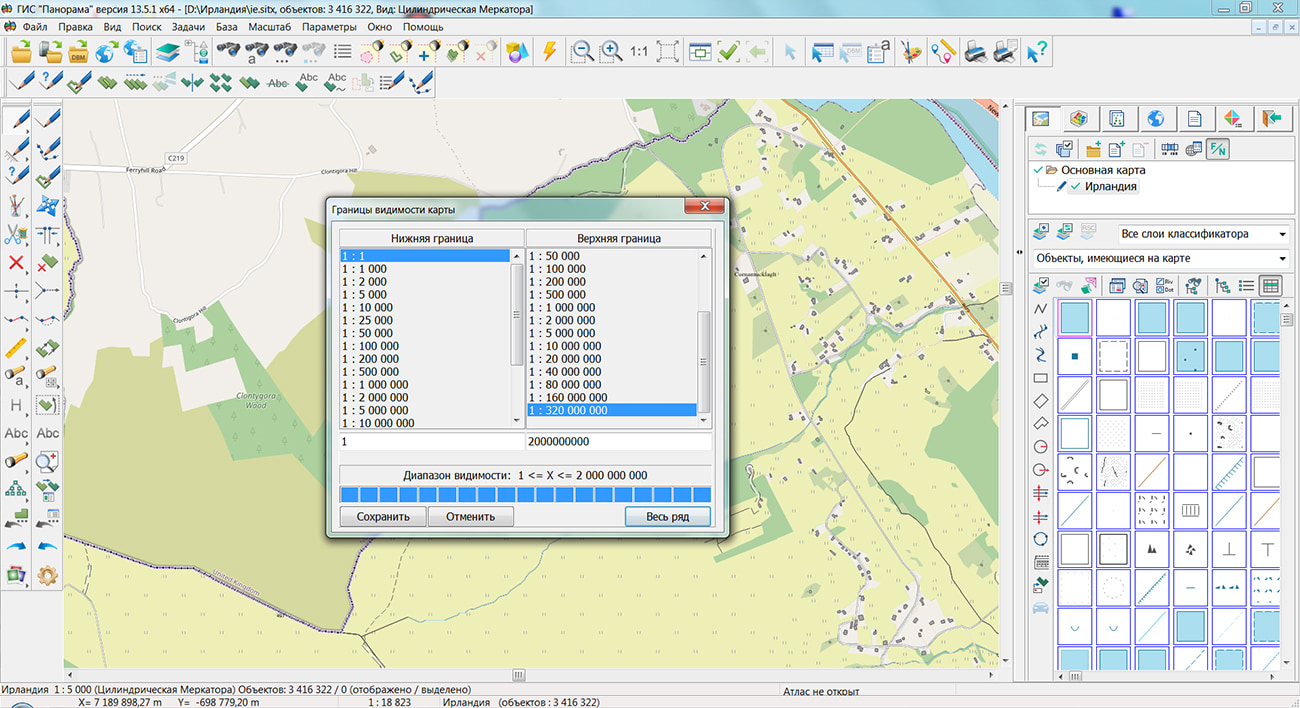
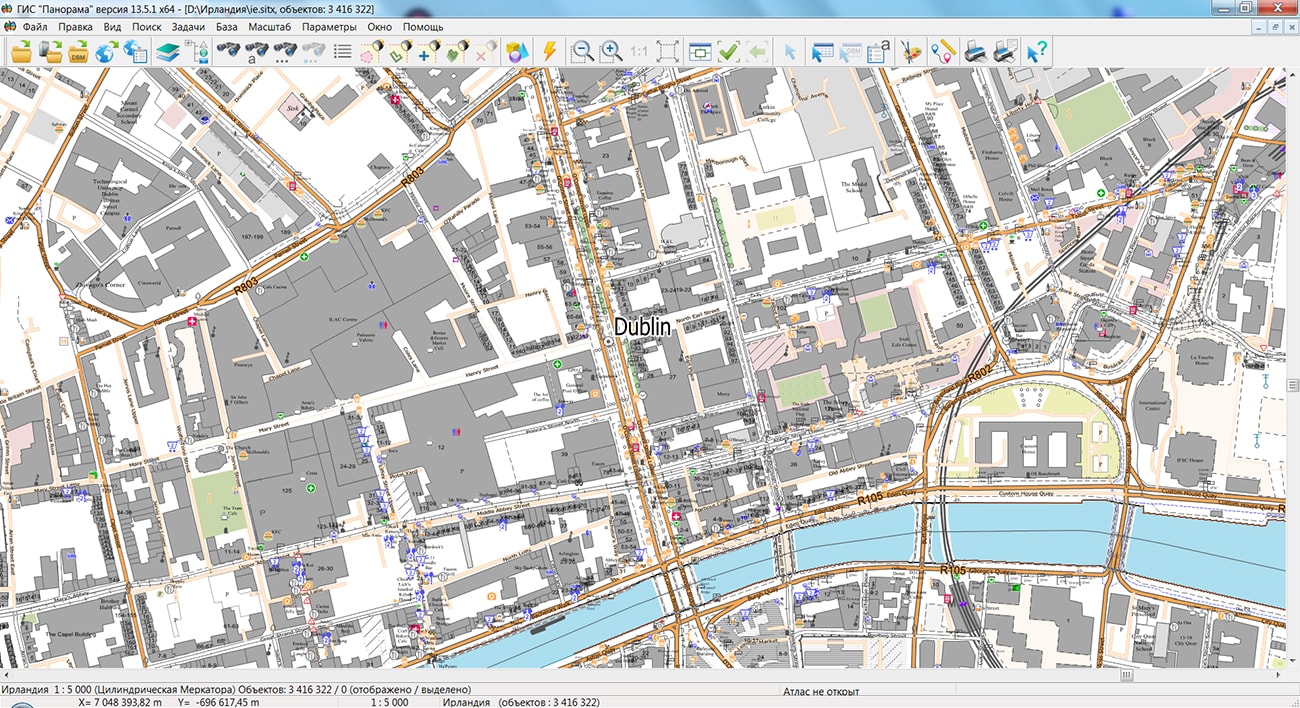
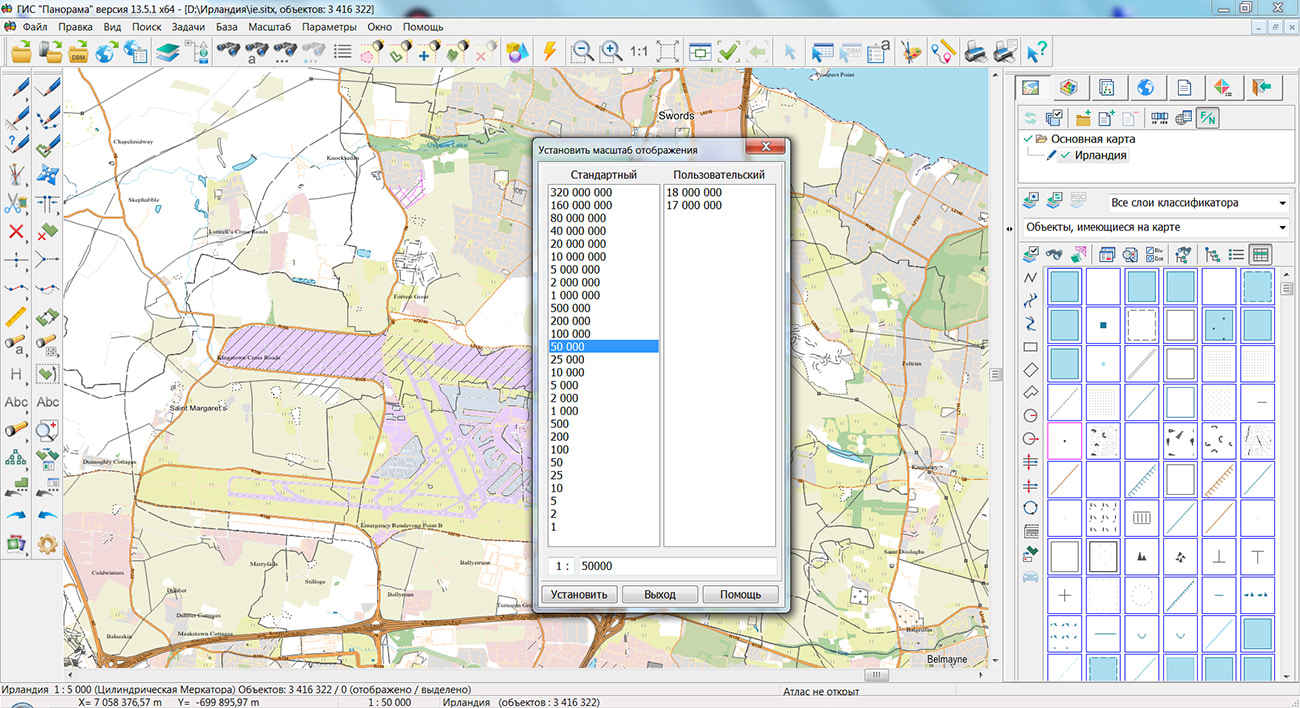
The geoportal has been supplemented with a map of Ireland, formed according to OpenStreetMap data. Source data obtained from Geofabrik website. To work with the map, you can use the program or other software products of KB "Panorama".
The map was led to the modernised classifier of large-scale plans of scale 1: 5 000 (map5000m.rsc). Publishing of updates in bank of spatial data is made by using the program of . Publishing contents of bank of spatial data on the geoportal and data access for downloading are implemented by means of .
Free maps on the basis of OpenStreetMap data are available for download on the page "Digital maps".


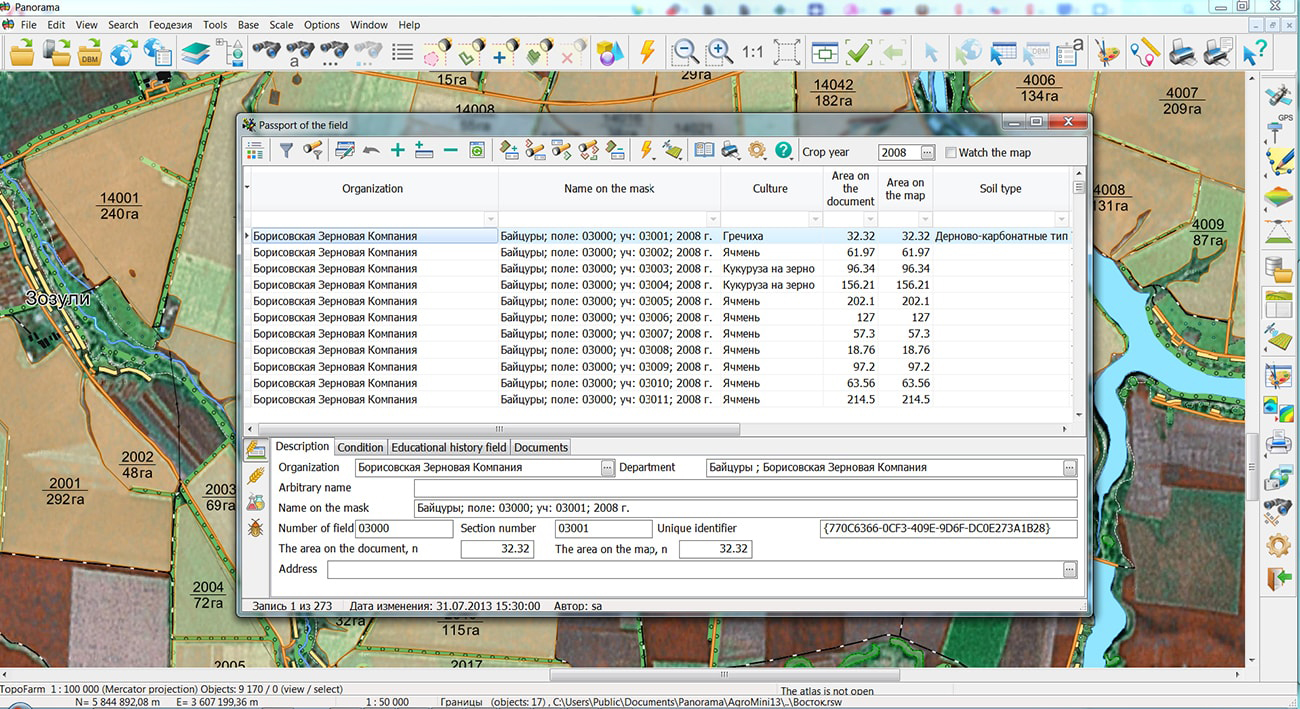
In KB the Panorama the "Workstation of Agronomist" version 13.6 has been developed. The new version of the program is focused on solving the problems of creating and applied use of digital maps of agricultural land in conjunction with the agrarian base. The industry classifier is designed to create digital maps. Drawing and editing of the contours of objects of industrial designation is carried out using the built-in "Map Editor". The "Passport of field" task ensures the maintenance of data on business entities, crop rotations, phytosanitary conditions, agrophysical and agrochemical properties of agricultural land contours. The new version of the program implements localization into English of all modes intended for the creation and editing of cartographic and attributive information about agricultural land, including the processing of field survey materials and the results of laboratory analysis of agrochemical indicators of arable land.
In the task "Lists of objects" when searching for intersection and overlap of objects, the "Matching contours" mode has been added. The mode carries out search for the contours of agricultural land at which the external and internal contours coincide with other farmland or other objects (cadastre, land management, forest management and others).
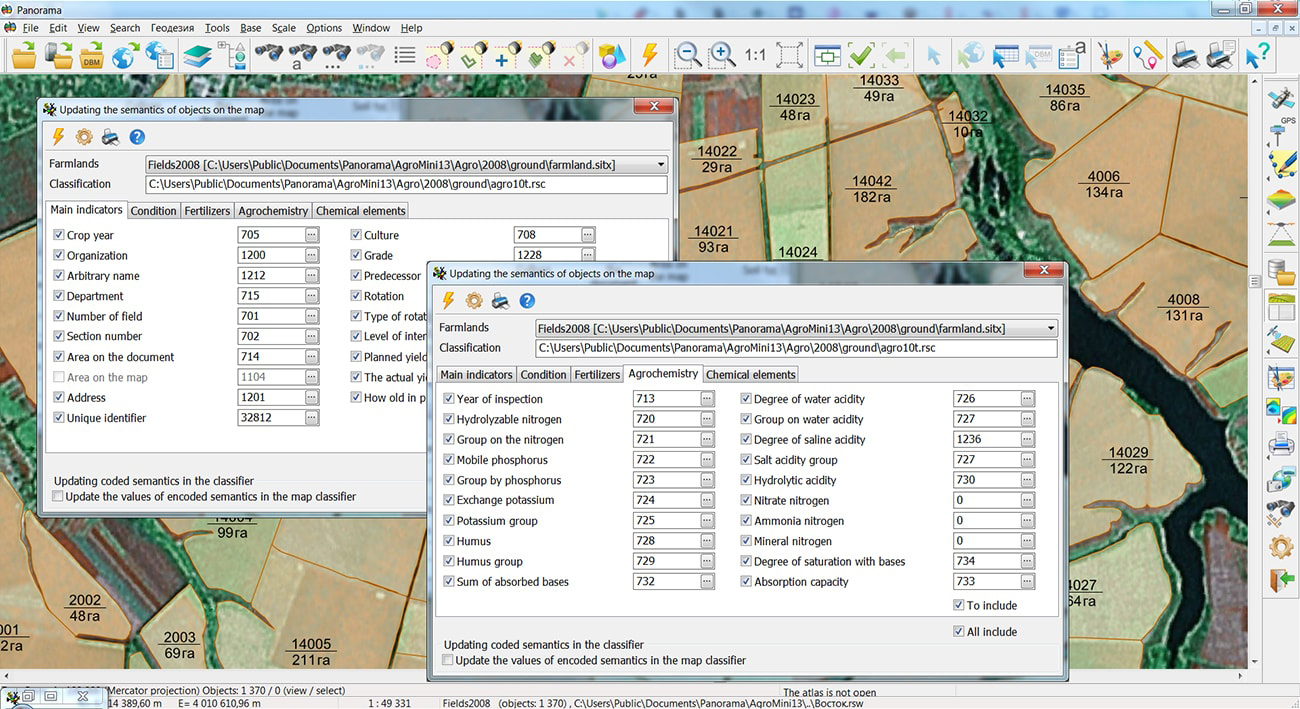
To update the data of the electronic farmland map, the "Collecting field measurements" mode is used. When carrying out field work, an agronomist can take with him a mobile device (tablet), on which the "Workstation of agronomist" software is loaded with a working map. On this map, you can immediately clarify the boundaries of the working areas of the fields, create new areas, and also enter the semantic characteristics of the fields for various soil measurements. In the "Update semantics" mode, a synchronization of the attributes of agricultural land, recorded in the semantics of the map during autonomous work in the field, with the information stored in the agrarian database is provided.
"Map print" dialog has been improved. Ability has been added to limit the display area of the map by the border of the selected areal or closed line object. In this case, you can set the degree of transparency of the map display outside the borders of the main contour of the object from 0 (source image) to 100% (completely filled). This mode is called through the context menu in the "Map print" dialog by pressing the "Select area by object" button.
"Workstation of agronomist" supports the processing and analysis of data of satellite monitoring. Interaction with an external service of Earth's remote sensing data is provided to obtain matrices of vegetation indices, maps of zones of inhomogeneities of fields and a time series of averaged values of vegetation indices. The resulting maps and matrices are used to analyze the amount of biomass in order to make management decisions in agriculture. The download source is the Geosys web service.
The data on the contours of agricultural land are represented by vector maps, matrixes of relief heights, matrixes of vegetation indices, maps of heterogeneities, thematic maps and matrixes. The hierarchical structure of the project of agrarian data can include unlimited number of maps and matrixes. To speed up the opening and first display of maps, the formation of a binary tree of territorial distribution of objects for each map sheet has been added. When the map is opened, the object tree is read, which accelerates the first display by 5-15 times (for a map with 2 million objects, the opening and first display is accelerated from 9-12 seconds to 1 second).
The display of DEMs has been improved, the color of the coverage point is calculated based on 16 adjacent heights using the bicubic interpolation method. The new method of obtaining the color of an element allows you to eliminate the discreteness of the display of the matrix and the light-shadow relief mask. To display DEMs with smoothing, enable the main menu item "Options" - "Display matrix with smoothing".
"Workstation of agronomist" provides information exchange with external programs. For this, scheme of exchange in the form of XML format files is provided. The joint functioning of the "Workstation of agronomist" and information and control systems on the 1C platform, configuration "AgroHolding" and Management of an agricultural enterprise is supported. The exchange scheme is two-way, which allows import and export of data.
All modes of the "Workstation of agronomist" work with the agrarian database in the "Panorama AGRO" structure and support the placement of data on the GIS "Server" to ensure collective multi-user access. There is added the ability to specify the environment variable instead of the host name in the name of data opened from the GIS Server. It allows to customize MPT/MPTZ projects of data (having replaced a server name with an environment variable) which can, if necessary, be transferred into another network environment (for example, from a test platform onto production platform) without reconfiguring the addresses of the data being opened. When saving MPT/MPTZ projects, the server name is automatically replaced with an environment variable if it is set for the given server name.
The new version of the program is available for download in the Download section.


In KB "Panorama" the has been developed. In the new version, the tools for viewing and editing tables of attributes of spatial databases have been expanded. Modes are added: select/cancel linked objects, show records for selected objects, show information about a map object for the current record. In dialog the tools for convenient viewing the table with a large amount of data are added: customization of the order of displaying columns, change of their width, setting the visibility status of columns. GIS "Panorama" provides direct display and editing of arbitrary spatial databases in cartographic conventional symbols, including those created by other GIS, without additional third-party modules based on direct interaction with PostgreSQL and Oracle DBMS through SQL queries.
The block of geodesy and cadastral tasks has been improved. In a mode "the Information from the state cadastre of real estate" is realised support API of functions of Rosreestra on access to the data. The mode provides sending requests for information about the cadastral objects available at the specified point. The obtained information in the form of a list of cadastral numbers is displayed on the corresponding pages of the dialog. When choosing a specific cadastral number of an object, a request and display of public cadastral information about a quarter, land plot or real estate object are performed.
In the "Map Editor" task, the composition of the "Graphic Objects" panel has been expanded: modes have been added for controlling the color, scale, transparency of the conventional symbol of the object selected on the map. In the mode of editing common vertexes the function of capture of nodes of other objects ('K') has been added. In the mode of union of selected line objects, the option Create polyline has been added to combine the selected line objects into one object.
In the task "Lists of objects", the "Matching contours" mode has been added into the crossings search. The mode carries out search of objects at which the external and internal contours are matched. The direction of digitization, the position of the starting points and the sequence of the contours of the found objects may not coincide.
"Map print" dialog has been improved. Ability has been added to limit the display area of the map by the border of the selected areal or closed line object. In this case, you can set the degree of transparency of the map display outside the borders of the main contour of the object from 0 (source image) to 100% (completely filled). This mode is called through the context menu in the "Map print" dialog by pressing the "Select area by object" button.
In the application task "Report editor" the possibility has been added for automated formation of a set of map reports in jpg format of specified permissions in accordance with a prepared list. It simplifies embedding of reports into various documents and their updating.
When saving and opening the projects of maps in MPT\MPTZ format, the currently specified display composition for each project map is taken into account. Into a project file the records of XML format in the form of sections with the name [#xml#vclxNNN] are added. This allows you to form projects of different composition of layers, scale, color design from one set of maps for use in the form of insets in various reports and other tasks.
The display of DEMs has been improved: the color of the coverage point is calculated based on 16 adjacent heights using the bicubic interpolation method. The new method makes it possible to smooth the discreteness of the display of the matrix elements and the light-shadow mask (hillshade) of the relief, as well as to cut the image of the matrix by the frame with pixel accuracy. To display DEMs with smoothing, you must enable the main menu item Options\Display matrix with smoothing.
In the task "Navigator 3D" new types of displaying surfaces, reliefs, objects have been added. The surface can be in the type of: a map with a customizable display composition, a smoothed matrix, a background, or be absent. The relief can be full, nodular, skeleton or transparent. Objects can have a three-dimensional view according to the classifier and displayed as full or skeleton models, or have no assigned three-dimensional model and are displayed as a default view, built by the object's metric. Composition of the display of 3D-objects can also be customized for all maps through the "Composition of the display" on the main toolbar of the "Navigator 3D" task. A variety of settings for displaying all elements of a three-dimensional terrain model allows the user to customize it for execution of specific tasks. For example, a transparent relief allows you to view underground objects: buildings elements, communications and others. Nodular and skeleton view of a relief make it possible to see the details of its construction. Skeleton type of objects helps to estimate their relative positioning. The interface of the dialog for importing 3D models into the database of three-dimensional tiles DB3D has been updated.
In the new version the possibilities of work with the list of files of source models have been implemented: viewing the entire list of files, deleting the selected files from the list, clearing the file list. Display of a data source for a model binding is added: from file of model, from the list, from a file of metadata, from EPSG database. Ability has been added to switch between the data sources available for the model for binding by using the corresponding radio buttons.
In the "Navigator 3D" task, a mode for loading a cloud of points from MTD model into DB3D format has been added. The MTD model is used to store data obtained by methods of laser scanning, Earth's remote sensing (ERS) and others. They can be loaded, for example, from a file of LAS format. The model contains spatial coordinates of points (X, Y, Z) and their other characteristics (for example, color of a point in RGB format, a point code, value of intensity of laser reflexion). DB3D format is intended for storing spatial information about the terrain in the form of a pyramid of tiles, divided into scale levels. During the process of import from MTD-model the points are loaded into corresponding tiles of DB3D format. In dialog of import the user can set a point of a binding the model and a desirable scale range of the tile pyramid. At the same time, the detail of data presentation increases with each scale level, starting from the minimum. After importing data, the loaded model will automatically open with a transition to the point of binding.
To speed up the opening and the first displaying the map, there is added a formation of a file "* .sol" with a tree of territorial distribution of objects onto each sheet of the map. When the map is opened, the object tree is read and the first display is accelerated by 5-15 times (for a map with 2 million objects, the opening and first display is accelerated from 9-12 seconds to 1 second). When sorting a map in SITZ\MAPZ format or saving an MPTZ project, the object tree is saved in a packed data file with further acceleration of the first opening of the map. In the absence of the "*.sol" file, the automatic construction of a tree and file saving are carried out.
When importing a set of maps sheets of SXF and TXF format, specified by the list in the DIR file, the ability has been added to transfer sheets by longitude on +/-360 degrees. It allows to duplicate the columns of sheets in the western and\or eastern hemisphere for expansion of dimensions of work region up to -360/+360 degrees. To duplicate sheets, copy the required file with a different name (for example, rename 01-12.sxf to 01-12_west.sxf) and change its nomenclature so that all sheets in the region have a unique designation (for example, rename 01-12 to 01-12_west ). Then, in a text editor, add a line with a new name sxf or txf into the DIR file and press the tab after the file name and enter the direction of transfer (for example, -360 or +360). The recalculation of coordinates and sheet passport will be performed automatically when importing the work region using the DIR file.
There is added the ability to specify the environment variable instead of the host name in the name of data opened from the . The variable name must start from the string $gserv (for example, HOST#$gserv1#2047#ALIAS#data/noginsk.sitx). It allows to customize MPT/MPTZ projects of data (having replaced a server name with an environment variable) which can, if necessary, be transferred into another network environment (for example, from a test platform onto production platform) without reconfiguring the addresses of the data being opened. When saving MPT/MPTZ projects, the server name is automatically replaced with an environment variable if it is set for the given server name.
The program of checking the vector map has been improved. A new mode "Control of values by symbol table" has been added into the control of objects semantics. This control allows you to find Latin characters in the values of the selected symbolic semantics and replace Latin characters with Cyrillic characters. This mode is relevant for characters that have the same image in Latin and Cyrillic, for example: K, A, M, E, P, T, O, H and others. Correction of the text semantics is necessary for the correct operation of tasks of search by the value of symbolic semantics, for example: by the name of the city, street, surname.
In the task "Classifier Editor" a customization has been added for automatic recoding the semantics of the type "Classifier code (list)" when updating the classifier. This makes it possible to automate the process of replacing the list (a list of values and their codes) and rebuilding a series of objects created on the basis of the replaced semantics. Instead of introducing a new version of the classifier (RSC), a new semantics with a new list is added into the existing one. In its description there is specified a possible source of values by re-coding the list on coincidence of a key or a short string designation. Series of objects are updated according to the values of new classifiers of semantics. When the user replaces the old classifier in the folder with the map and opens the map, objects will be automatically recoded with the formation of new semantics that have values from the new values classifiers. Objects will be displayed with new conventional symbols. When replacing it with the old classifier, the conventional symbols will return to their previous view.
The survey.v5.rsc classifier has been updated, designed for creating land survey, technical plans, inspection reports, documents containing information about land management objects, public and other cadastral maps, drawings, as well as for reproduction of information contained in cadastral plans of territories and cadastral extracts of real estate objects. In the classifier there is expanded the list of objects to which the Floor type semantics (code 1119) has been added, necessary for preparing technical plans on creation, formation of objects of real estate, parts of real estate objects, as well as technical plans for changing information about real estate objects and their parts.
The emercom.v2.rsc classifier has been updated, designed to create electronic maps of emergency situations. For accounting objects under the jurisdiction of the Ministry of Emergencies, and highlighting these objects with special conventional symbols, the following objects have been added: "Label of an object under the jurisdiction of EMERCOM", "Label of an object under the jurisdiction of theEMERCOM (simplified)", "Building under the jurisdiction of theEMERCOM".
The new version of the program is available for download in the section.


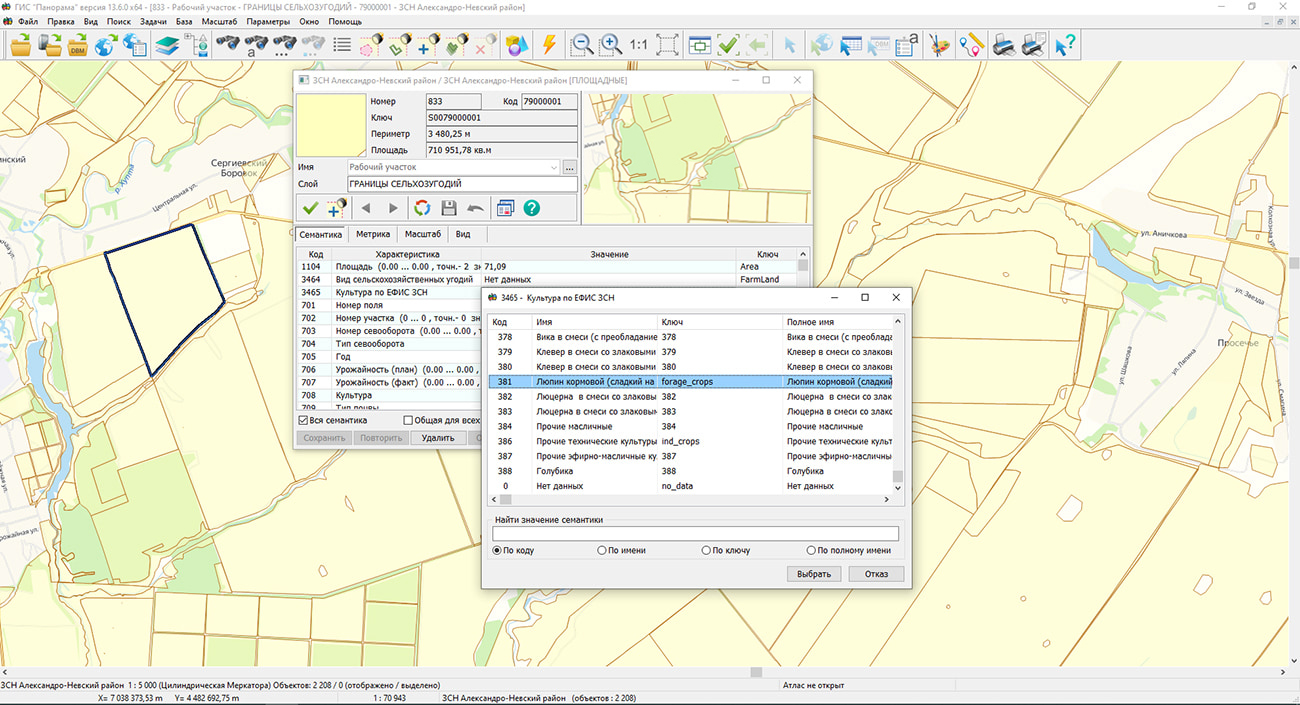
In KB "Panorama" the digital classifier of a map , intended for creating and conducting maps of agricultural land and thematic mapping of fields, has been improved. The classifier was added by new semantics «Culture on EFIS ZSN». EFIS ZSN is a unified federal information system about agricultural lands, designed to provide up-to-date and reliable information about such lands, including data on their location, condition and actual use. Due to the inclusion of new semantics into the classifier, it became possible to create maps of farmland in full compliance with the requirements for collecting and aggregating data within the boundaries of each field, municipal formation and subject of the Russian Federation. For visual assessment of crop rotations, the state of fields and soils, thematic mapping is intended, where information about agricultural lands is presented in special conventional symbols associated with the values of various attributes.
The classifier includes settings that automate the process of rebuilding a series of objects created on the basis of the "Culture" semantics according to the semantics "Culture by the EFIS ZSN". This feature is supported for semantics with the "Code from classifier (list)" type. The very recoding of maps is provided by the GIS "Panorama", which allows not to create several series of objects, but to use the most detailed series with the substitution "on the fly" of semantics values with the "Code from classifier" type. For this purpose the values of a key or a short designation of a string should coincide.
When you open a map created by an outdated version of the classifier, the objects will be automatically recoded with the formation of new semantics that have values from the new classifiers of values. Objects will be displayed with new conventional symbols. When replacing it with the old classifier, the conventional symbols will return to their previous form.
The updated classifier is available for download in the "Classifiers" section.


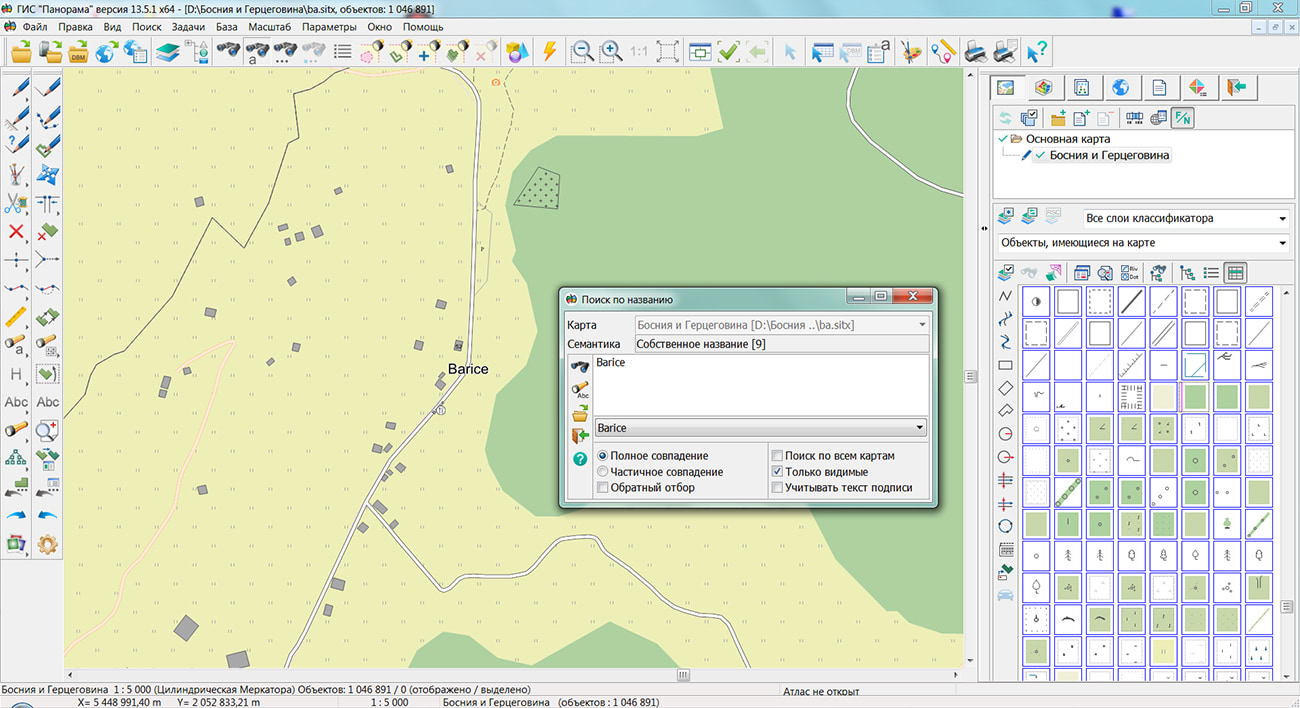
The geoportal has been supplemented with a map of Bosnia and Herzegovina, formed according to OpenStreetMap data. Source data obtained from Geofabrik website. To work with the map, you can use the program or other software products of KB "Panorama".
The map was led to the modernised classifier of large-scale plans of scale 1: 5 000 (map5000m.rsc). Publishing of updates in bank of spatial data is made by using the program of . Publishing contents of bank of spatial data on the geoportal and data access for downloading are implemented by means of .
Free maps on the basis of OpenStreetMap data are available for download on the page "Digital maps".


Ph.: +7 (495) 739-0245, +7 (925) 221-1603
www.gisinfo.ru | panorama@gisinfo.ru
105005, Russia, Moscow, Baumanskaya Street 7, building 1, office 229 (m. Baumanskaya)
Copyright © Panorama Group 1991 - 2024


 Mobile version
 Full version